
This post is about SAP BusinessObjects Dashboards (formerly known as Xcelsius) and its intricate form of work. If you are an assiduous dashboard developer or just beginning to work with the tool, you will notice some bugs that interfere with your developing and slows you down. My main goal is to talk about the bugs or "misfortunes" that I have commonly faced in SAP BO Dashboards (Xcelsius) and the workarounds that I have found to save you some time when working with this tool. My second objective is to open a discussion where you can comment on other SAP Dashboards issues and solutions you found.
Integración de tablero en SAP Crystal Reports
In this blog article I would like to share with you how to embed a dashboard in a Crystal Report using flash variables. First of all let’s give a scenario that leads us to do that. In this case we wanted to create a dashboard for a SAP GRC module. The problem was that we could not connect to the system directly with SAP BusinessObjects Dashboards (Xcelsius for the most nostalgic ones). Apart from that, there is a good thing about having a dashboard embedded in Crystal, you will have a dashboard that can be refreshed from Crystal Reports without needing a previous authentication. You will also be able to save the “report” (you can show the dashboard) in PDF with saved data and the dashboard will be completely clickable and navigable.
Join Clariba at the SAP Forum & SUGMENA Conference - Doha mayo 28 2013
Únete al evento Real-Time Insight con SAP Business Analytics - Muscat mayo 21
Cómo cargar y leer Web Services Data Store en Data Integrator
En este artículo, le enseñaré en 12 pasos cómo cargar y leer la información recuperada por un servicio web basado en una aplicación Java como fuente de información. Esto tiene una característica muy importante si, por ejemplo, está creando aplicaciones Java Social Media que leen información de Internet o si ha creado una aplicación Java que recupera información en Json Structure XML. Le mostraré cómo Data Services realiza solicitudes e interpreta las respuestas de un origen de datos de servicio web.
If you need background information on the first steps of my process, I have done a first post on how to use Data Services SDK libraries to construct an AWTableMetadata in a Java application, followed by the post where I explained how to access a JAVA application as a source of information using the WebService DataStore in SAP Data Services.
Si ya lees mis blogs anteriores, vamos a saltar en cómo cargar y leer Web Services Data Store en Data Integrator.
Paso 1:
Open Data Services Designer. Go to the Data Store perspective and right click with the mouse and select New.
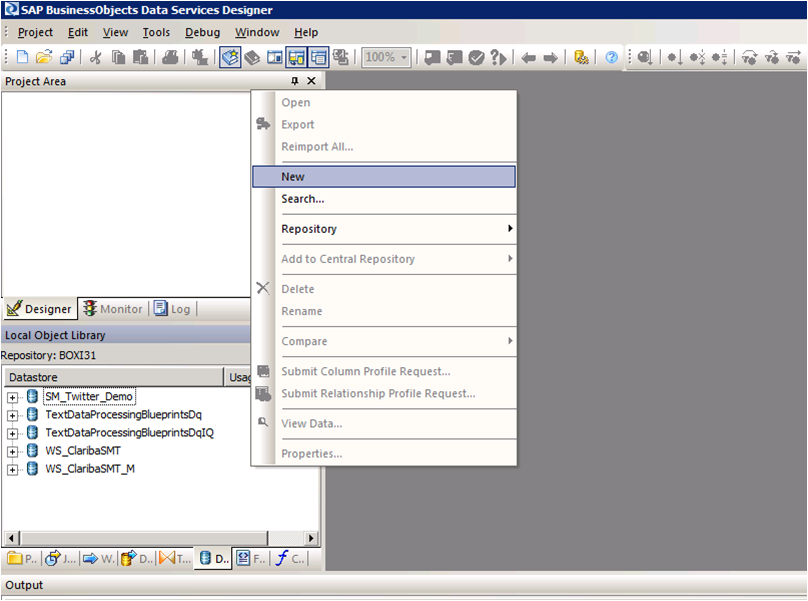
Foto 1
Paso 2:
Set the name of the extractor and the URL where your web service WSDL is located (see my previous blog for reference).
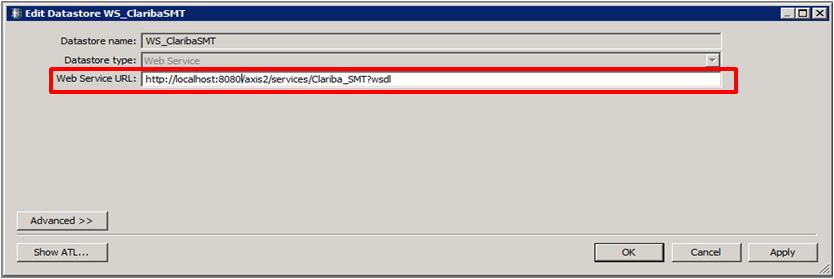
Picture2
Paso 3:
Right Click on the “f(x)” symbol and select Import. Choose the functions from the webservice that you are going to use. In this example we select “getTableTweeetsEN” and “getTableTweeetsES”.

Picture3
Nota especial:
Para acceder a estas funciones dentro de una transformación tenemos que usar el esquema de llamada de función proporcionado por Data Services. En este caso, la función getTableTweets_EN recibe una entrada y devuelve una tabla (tabla AWTableMetadata). Este tipo de retorno viene en un formulario anidado de nuestro Servicio Web. Tendremos que resolver este esquema anidado haciendo un par de transformaciones a continuación.
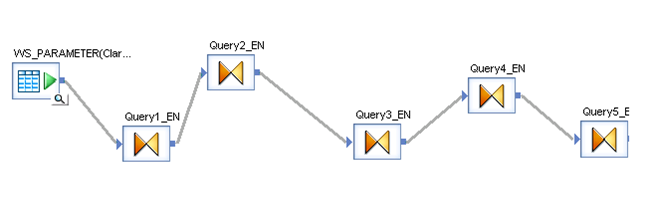
Imagen4
Paso 4:
Seleccione el parámetro de entrada para las funciones; En este caso es un campo de una tabla llamada "WS_Parameter". Seleccionamos esa tabla como una tabla de origen y nuestro primer elemento en nuestro flujo de datos.
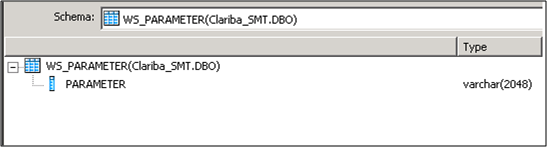
Picture5
Paso 5:
Inserte una transformación en el flujo de datos como su segundo elemento. En esta primera consulta (Query1_EN). Creamos un SCHEMA llamado Schema 1, y asignamos el campo proveniente de la base de datos "Parameter" como un atributo de este Schema.

Picture6
Paso 6:
Cree una segunda transformación (Query2_EN). Esta consulta se encargará de llamar al servicio web con el parámetro de entrada mediante el procedimiento de llamada de función. Haga clic con el botón derecho del ratón en la tabla de esquemas llamada Consulta2 y seleccione Nueva llamada de función.
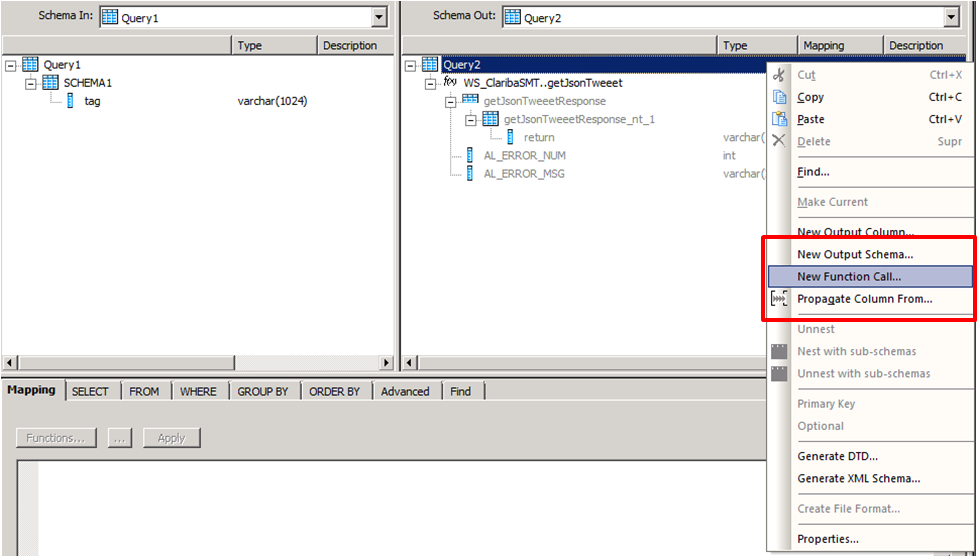
Picture7
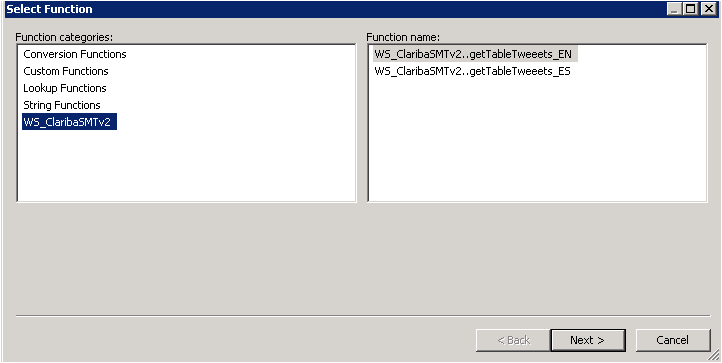
Paso 7:
Seleccione el WS_ClaribaSMT dataSotre en el panel izquierdo, el panel derecho muestra las funciones que importamos al Data Store. Seleccionamos el primer getJsonTweet (para el idioma inglés) y clicamos en Siguiente.
Picture8
Paso 8:
We have to map the new function call Schema with the new Schema1. This is the structure used to call a Web Service in Data Services. In this case we are calling the function getJsonTweets_EN with a parameter nombre. Structure that matches our SHEMA1. Then click Finish.

Cuadro9
El resultado final contendrá la llamada a la función. También puede agregar un atributo debajo de la llamada de función. En este caso agregamos "load_date" que contiene el sysdate que representa la fecha de los datos de carga.

Cuadro10
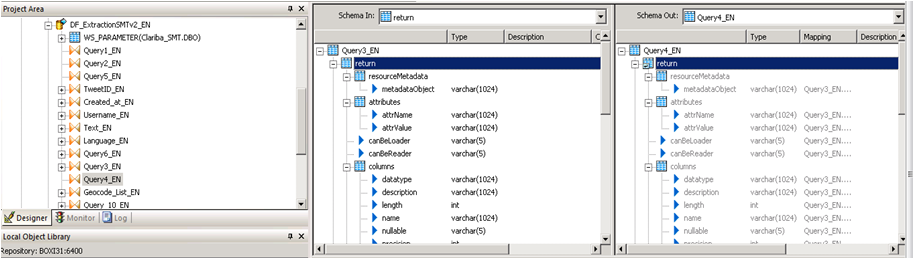
Paso 9:
La tercera consulta se encargará del reconocimiento de los datos devueltos por el servicio Web. En este caso, el Esquema se encuentra en el panel izquierdo. Para capturar esto en el integrador de datos necesitamos desacoplar este esquema hasta llegar al "objeto de retorno" que contiene los datos.

Cuadro11
Hacemos clic en el panel izquierdo encima de getJsonTweetResponse y lo arrastramos hacia el panel derecho. Luego hacemos clic derecho sobre el getJsonTweetResponse desde el panel derecho y seleccionamos la opción "Unnest". Esto causará la división entre los esquemas. Procedemos a capturarlo en la próxima consulta anidada.

Cuadro12
Paso 10:
Hacemos el mismo procedimiento en la consulta 4, arrastramos el getJsonTweetResponse a la derecha y lo desentrañamos.
Cuadro13
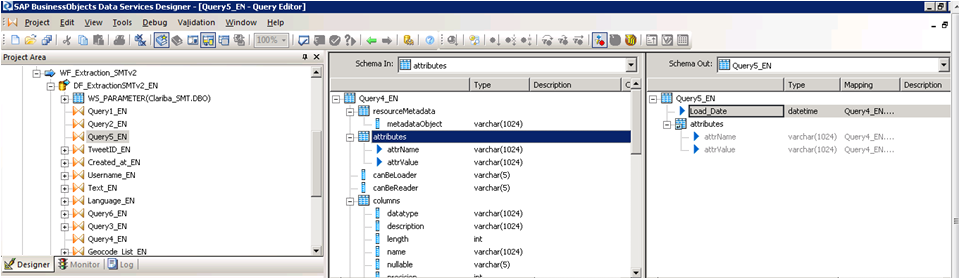
Paso 11:
Query 5_EN contains the final result which be two variables that contains the header of the table plus the Load Date.
Cuadro14
Paso 12:
El último paso depende de la implementación y las reglas de negocio. La tabla devuelta tendrá este formato.
Columna 1
Valor 1
Columna 2
Valor 2
Columna N ...
Valor N ...
Conclusión
Este método se aplica especialmente si está utilizando esquema de llamada de función y una matriz como tipo de devolución para su servicio web. Si su fuente es otra cosa diferente a una aplicación, la resolución del servicio web puede variar. El método para asignar la tabla final depende de usted y de sus necesidades empresariales. Una solución fácil podría ser agregar un ID a cada fila.
Si desea tener más información, lea mis blogs anteriores o deje un comentario a continuación.
Ahorrando el tablero de instrumentos con un clic en movimiento
Looking forward to add a little more to your visualizations? Spice them up with a clickable moving ticker! For those who are not familiar with Dashboard Design (formerly known as Xcelsius), a moving ticker is a banner which has a similar look to a stock market ticker displaying customized moving labels from right to left. The one described here is also clickable, which means that when you click on any label it can execute many actions such as opening URL’s.

We always try to build dashboards that people really use, and for that we need to find a balance between functionality and design. The design might not seem as important as the functionality, but trust me, in order to get the attention of users you need to build something that really catches their eyes, such as this ticker feature which is easily noticeable to do it´s constant movement.
Step by step process
In order to help you make your Dashboards eye-catching, I am going to show you how to build a clickable ticker to open URL’s with the following steps.
Let’s start by organizing our spreadsheet (find example below – Fig.1) with the following information:
- Labels: Information that will be displayed on the ticker
- URLs: Links that will be opened when clicking on the labels
- Auxiliary info: cells containing Index, destination, status, key, URL to open, which will be explained later on

When your spreadsheet is ready follow these steps:
1) Drag and Drop the ticker object to your canvas.
The ticker object can be found under the category “Selector”.

2) Configure the Ticker object’s properties.
In the General tab, assign the labels you would like to show on the dashboard.
Insertion type: Position
Destination: This cell is key as it will give the position number of the clicked label on the ticker.
e.g: If you click the third label of the ticker this cell will be a “3”, it it will change when you click another label.

3) Drag and Drop a URL object to your Canvas.
The URL object can be found under the category “Web Conectivity”

4) Configure the URL object’s properties and behavior.
URL: In this cell you need to build a “vlookup” formula as it is shown in fig.1.

In the behavior tab under the Trigger Behavior properties you find:
Trigger cell: This is going to be the same as the destination cell of the Ticker (Sheet1!D$4 in this case – Fig 2.).
Check the “When Value Changes” option.
Hide this button by selecting different values for the status and key cells as below:

The outcome and conclusions
After completing these steps you should have built a clickable moving ticker which will spice up your visualization.
This solution will allow you to:
- Open Intranet/Internet URL’s from moving labels.
- Change visibility dynamically for graphs and images from you Dashboard Design visualization.
- Enhance the design and gain visibility of your visualizations
I hope this feature is useful to you and it brings positive feedback from your end users. Please feel free to leave a comment or question below.
Gestión de dependencias ETL con SAP BusinessObjects Data Services (Parte 2)
Are you satisfied with the way you currently manage the dependencies in your ETL? In part 1 of this article, I talked about the features I’m expecting from a dependency management system, and what are the main possibilities offered (directly or indirectly) by SAP Data Services. Now (part 2 of the article), I’m going to propose an architecture (structure and expected behavior) for a dependency management system inside Data Services. The implementation details will come in part 3, while a feedback on how it went “in real life” as well as possible improvements will come in part 4.
La arquitectura propuesta
What I’m going to develop now is the following: an improvement of the “One job with all processes inside” architecture.
Las principales características de esta arquitectura son:
- Gestión de múltiples dependencias (un flujo puede depender de múltiples procesos)
- Un gracioso reinicio es posible. El reinicio ETL completo también es una opción.
Primero debemos crear dos tablas, FLOW_DEPENDENCIES y FLOW_STATUS.
- La tabla FLOW_DEPENDENCIES tiene dos columnas FLOW_NAME y PREREQUISITE. Tiene una línea para cada prerrequisito.
Para el ejemplo siguiente (dependencias de flujo lógico en un trabajo) ...
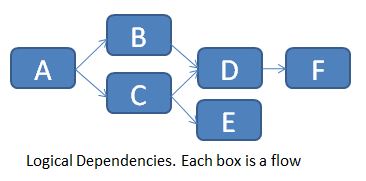
... relataremos la tabla FLOW_DEPENDENCIES de la siguiente manera:

Por supuesto, no puede implementar directamente estas dependencias lógicas en los Servicios de datos, por lo que es necesario encadenarlos uno tras otro.

La tabla se actualiza manualmente cada vez que hay un nuevo requisito previo. Un flujo sin requisito previo no necesita ninguna fila en esta tabla (ver flujo A por ejemplo).
La tabla FLOW_STATUS realiza un seguimiento de los diferentes estados de flujo (ya se ejecutan, Sucesos, Fallas, Requisitos previos faltantes) para cada ejecución del trabajo principal. Las columnas 3 son JOB_KEY (que contiene una clave sustituta para cada nueva ejecución del trabajo), FLOW_NAME y STATUS.
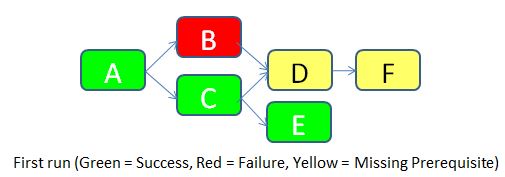
Para dejar las cosas claras, imaginemos que ejecutaremos el trabajo por primera vez (JOB_KEY = 1).
- El flujo A no tiene ningún requisito previo, por lo que se permite ejecutar. Tiene éxito. Se inserta una fila con STATUS = Success en la tabla FLOW_STATUS.
- El flujo B tiene un requisito previo de acuerdo con la tabla FLOW_DEPENDENCIES (el flujo A), por lo que comprueba el estado del flujo A en la misma ejecución. Resulta que el flujo A fue exitoso, por lo que se permite que el flujo B se ejecute. Desafortunadamente, falla por una razón desconocida. Se inserta una fila con STATUS = Failure en la tabla FLOW_STATUS.
- Se permite que el flujo C se ejecute de acuerdo con la misma lógica que para el flujo B. Se ejecuta con éxito. Se inserta una fila con STATUS = Success en la tabla FLOW_STATUS.
- El flujo D tiene dos pre-requisitos de acuerdo con la tabla FLOW_DEPENDENCIES (flujos B y C). Comprueba el estado de ambos. A medida que el flujo B falla, el flujo D no se deja correr. Se inserta una fila con STATUS = Requisito faltante en la tabla FLOW_STATUS.
- Se permite que el flujo E se ejecute de acuerdo con el mismo flujo lógico B. Se ejecuta correctamente. Se inserta una fila con STATUS = Success en la tabla FLOW_STATUS.
- El flujo F tiene un requisito previo (flujo D). Pero como el estado del flujo D es "Requisito faltante", el flujo F también no se permite correr. Se inserta un estado similar en la tabla de estado de flujo.
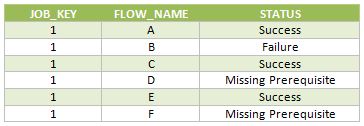
A continuación se muestran las filas insertadas en la tabla FLOW_STATUS durante esta ejecución del trabajo.
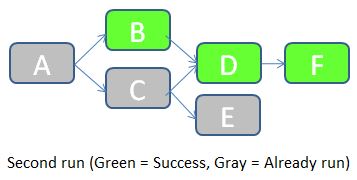
Una vez corregida la causa del error en el flujo B, podemos volver a ejecutar el trabajo. JOB_KEY será igual a 2, e indicaremos al trabajo que debe comprobar los estados del trabajo anterior (en el que JOB_KEY = 1).
- El trabajo comienza comprobando el estado del flujo A en la tabla FLOW_STATUS con JOB_KEY = 1. Como el estado es igual a Éxito, el flujo A no necesita ejecutarse en este trabajo. Se inserta una fila con STATUS = "Already run" en la tabla FLOW_STATUS.
- El estado del flujo B con JOB_KEY = 1 es "Fallo". Por lo tanto, el flujo B debe ejecutarse durante este trabajo. A continuación, el trabajo comprueba el estado del requisito previo (el flujo A) para JOB_KEY = 2. Resulta que el flujo A ya estaba ejecutado, por lo que se permite que el flujo B se ejecute. Se ejecuta con éxito. Se inserta una fila con STATUS = Success en la tabla FLOW_STATUS.
- Los flujos restantes siguen una lógica similar.
A continuación se muestran las filas insertadas en la tabla FLOW_STATUS durante esta ejecución del trabajo.

Como puede ver, esta solución gestiona las dependencias de ETL, mantiene el rastro del historial de carga y permite fácilmente una re-ejecución parcial del ETL si una parte de éste falla. En la siguiente parte os daré los detalles de la implementación de Data Services: qué scripts / flows / functions / etc. Debemos usar ¿Cómo hacemos este sistema fácil de implementar y mantener? Hasta entonces, espero su opinión sobre esta arquitectura propuesta. ¿Se ve bien? ¿Cómo lo mejorarías? Háganme saber con un comentario a continuación.
Join SAP and Clariba for the Real-Time Business Analytics with SAP Business Intelligence event - Doha abril 22
|
|
|||
|
|||
 |
|||


|
|
||||||||||||||||||||||||||||||


| If you would prefer not to receive such e-mails in the future, please click on the Unsubscribe link. |
- Overview of RDS – fixed price, time and scope projects- Examples of RDS & their benefits to customers
Join Clariba at the SAP Analytics Forum Doha (abril 8) and Dubai (abril 10)
Clariba would like to invite you to attend the SAP Analytics Forum in Doha - abril 8 and Dubai - abril 10. Join us and SAP MENA´s top-level management to gain valuable insights around Business Analytics and how it can help your company run better.
In Doha we will be presenting one of our success stories in the region alongside our customer QAPCO, on the Business Intelligence re-imagined track: QAPCO´s journey to innovation – from a 360 BI assessment to analytics on HANA
In Dubai our managing director Marc Haberland will be presenting in the Finance Re-imagined track: Benefit from rapid time-to-value with FastTrack BI for Finance.
¿Por qué asistir?
In addition to catching Clariba in the customer tracks in the afternoon, SAP Analytics Forum has a packed one-day programme to offer to IT and Finance leaders. You will get a chance to:
- Discover how to extract more value from business data by making analytical insight accessible, real-time, predictive, visual, mobile and social
- Learn best practices and repeatable successes from customer speakers, business experts and analysts
- Build connections and share experiences with their counterparts in leading organisations, and meet multiple SAP specialists under one roof
Marca tu calendario
DohaDate: abril 8, 2013Timings: 08:45 – 16:15Venue: Oryx Rotana, Doha, QatarCost: Free to attendREGISTRAR AQUÍ
DubaiDate: abril 10, 2013Timings: 08:45 – 16:15Venue: The Address Marina, Dubai, UAECost: Free to attendREGISTRAR AQUÍ
Selección de dispositivos para SAP BI Mobile
For companies migrating to, or purchasing the newest SAP BI4 platform, a big question arises: which device should be acquired for employees to access BI? The answer to this question may vary depending on the user profile and type of information they want to access. This article focuses on apple and android devices which are the most sought after in the market nowadays.
Current SAP BI Mobile options
SAP BI currently has the following fastest growing options for mobile: The first 2 are apps freely downloadable from App Store or Google Play and a 3rd option is a direct access to an HTML5 Dashboard through an internet browser.
SAP BI Mobile: It allows visualization of developments from:
- Web Intelligence
- Dashboards (aka Dashboard Design or Xcelsius)
SAP BusinessObjects Explorer: It allows to interact with:
- Explorador
- Exploration Views
Dashboard Design HTML5 extract: This is a working non-refreshable dashboard item.
The advantage of this is that it does not require any SAP BusinessObjects platform and can be accessed from any browser like Safari or Goggle Chrome as well as desktops – not only tablets -. The disadvantage of this is only offline, not-connected models are allowed and no security can be applied so this option is usable as demo material only. If you want to achieve this follow the method described in this article.
Dispositivos
The two device types that will be analysed here are tablets and phones.
IPad and IPhone by Apple are the ones currently well supported by vendor SAP, while some features can currently be accessed also by Android where unfortunately improvements are still pending in the area of Explorer and Dashboards and HTML5 during 2013. So for this reason this article will focus primarily on iOs devices. For a full specification of them check http://en.wikipedia.org/wiki/IPhone y http://en.wikipedia.org/wiki/IPad
Applicability
Let’s consider the following case with four user types according to reporting information profile and role: Operational, Tactical, Strategic and Presales and the possibility of them having a phone, a tablet or both. Here is our recommendation for each technology option:
SAP BI Mobile: Web Intelligence
|
SBO Explorer: Explorer
|
SAP BI Mobile: Dashboards
|
Offline HTML5 developments
|
SBO Explorer: Exploration Views
|
A summary table describing applicability is shown below. The criteria for selection is basically the RAM memory of the device which is in a direct relationship with the visualization process performance of a Dashboard.

We found out that all of the devices with 512MB of RAM or less had difficulty processing a dashboard with 1000 rows of information or more. For instance the IPad1 could barely process 500 rows. The effects were a message popping up in SAP BI mobile: “Insufficient device memory - Loading failed: The dashboard is too complex” or the device Internet Browser freezing up or hanging up
Even if Android is not purely compatible just a few comments on our experience on it:
- Some WebI components like single cells and small tables are quite well monitored in any device
- HTML5 developments are partially viewable but some of the components show a corrupted appearance. The RAM limitation also applies, so Dashboards performance would only be good in devices such as Samsung Galaxy 3 or equivalent
For the time being we recommend to use Android for very operational users who just need a few lines of tabular information, until Explorer or Dashboard support becomes a reality. See in the table below the areas where Android currently can be tested. In here we do not refer to specific models because applicability and functionality also vary depending on the Android version.

Resumen
The information here if not official from SAP, but are based on our experience. This article will need to be updated during this year 2013, based on the growing improvements that SAP is planning for, as well as new devices being launched in the market.
For now we can state that for iOS consumers who are strategic or working on presales require an IPad3 or an IPad4, and for operative users or tactical who do not need Dashboard capabilities will fulfill their needs with an iPhone.
Regarding Android users, the future is promising but in the meantime we recommend to use it for very simple WebI developments only, no matter which device. And do not aim to use Dashboards or Explorer, hoping for a full compatibility during 2013.
If you have questions about this article, or if you want to share your experience or tips, please feel free to leave a comment.