""

Introducción a la supervisión de CMC en SAP BO4 SP4

Hace unos meses, un cliente me preguntó cómo ser consciente de los problemas (desconexiones) en los diferentes servidores y servicios de su SAP BO4 SP4 sin necesidad de una persona para comprobar constantemente el estado. Luego comencé a investigar sobre la función de monitoreo en el CMC. La verdad es que no hay demasiada información en la documentación, sólo algunas páginas en la Guía del administrador de la plataforma, o las publicaciones o referencias a este tema en la web. Con este post, intentaré compilar toda esta información que he encontrado y explicaré el uso de estas características interesantes y le daré una breve introducción al monitoreo de CMC.

First of all, let me explain what is CMC monitoring: Monitoring is a new feature of the CMC that appears with SAP BusinessObjects 4 and allows Administrators to see the use and health of the BO system. For this, it uses watches, probes, metrics and alerts. There are some default ones, which allow the Administrator to start playing around with monitoring without a huge knowledge on the topic and obtain really useful information about the status of the system. Before using  this feature we need to know the actions we must perform and the existing limitations.

Además, debemos asegurarnos de que la información para el monitoreo se almacene en la base de datos de Monitoreo. Esta es una base de datos Derby y funciona independientemente de los otros dos DBs en SAP BusinessObjects. Para activar la base de datos de monitoreo necesitamos iniciar sesión en el CMC, e ir a Aplicaciones, y hacer doble clic en la Aplicación de Monitoreo. Esto abrirá la ventana Propiedades de la aplicación de supervisión. Asegúrese de que "Activar la aplicación de supervisión" esté marcada. Haga clic en Guardar y cerrar. El paso final es reiniciar el Adaptive Processing Server (APS) si no se ha comprobado. La información de la base de datos se borra cada vez que llegamos a 1 GB de información. Podemos aumentar ese tamaño en el CMC.

Supervisión

Para acceder a la sección de monitoreo de la CMC, debemos ir a Aplicaciones> Monitoreo

Monitoring default view

Como podemos ver en la imagen anterior, hay 5 diferentes pestañas en esta sección: Dashboards, Metrics, Watchlists, Probes and Alerts. Vamos a correr a través de cada uno:
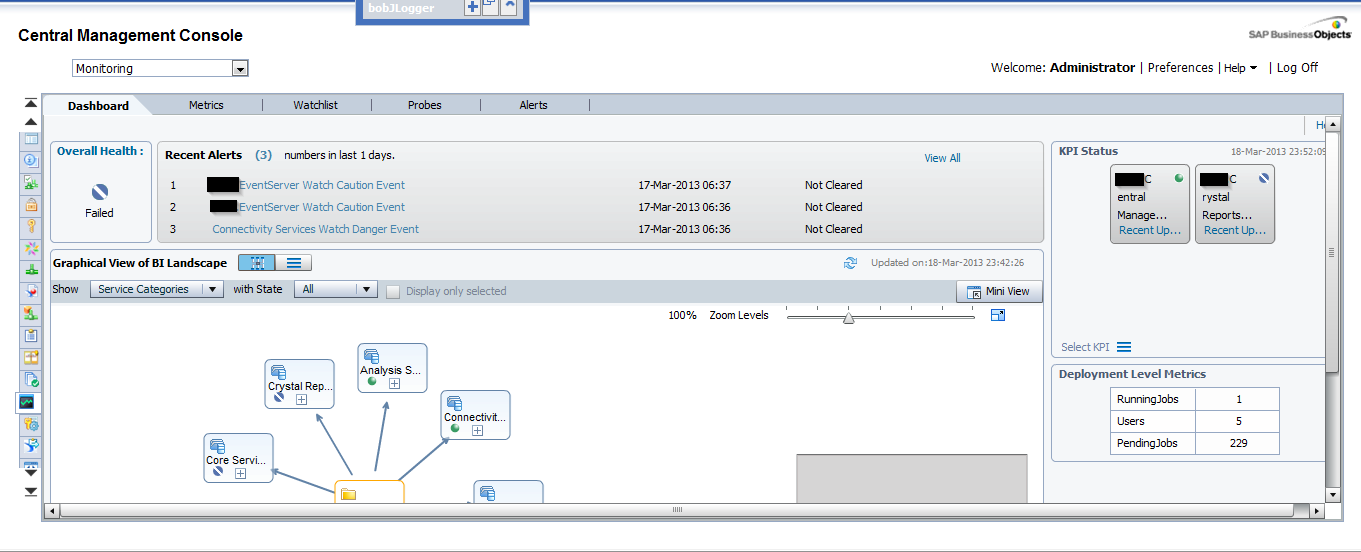
1. Paneles

es la pestaña predeterminada y como su nombre indica que es un tablero que está dividido en 5 partes:

  • Salud en general: Es un icono que muestra si la BO está funcionando correctamente o no.
  • Alertas Recientes: Aquí podemos ver las alertas activadas las últimas 24 horas por el sistema.
  • Graphical view of BI Landscape: this panel includes a graphical or tabular view of the Watches within the system .We can drill down click in them.
  • Estado de KPIs: Esta parte muestra tres Indicadores de Desempeño Clave para el sistema. También podemos profundizar haciendo clic sobre ellos.
  • Métricas de nivel de implementación: podemos ver 3 métricas interesantes como los trabajos en ejecución, los usuarios y los trabajos pendientes.

2. Métrica

Las métricas son piezas individuales de información que contribuyen a conocer la salud de los diferentes componentes del sistema.

Metrics image
Metrics image

Las métricas se utilizan para medir la salud de un componente. Las métricas que definimos dependerán de los componentes que estamos monitoreando y de nuestros requerimientos. Ejemplos de métricas son el tiempo de acceso del usuario, el tiempo de ejecución de la consulta, el porcentaje de uso de la CPU, el estado de disponibilidad de un servicio del sistema, etc. Podemos utilizarlos en Relojes y Alertas, estableciendo umbrales para alertas de advertencia y peligro. Hay alrededor de 250 métricas predefinidas. Además, podemos crear nuestras propias métricas si creemos que son necesarias. Normalmente, con los predeterminados, podemos comprobar el estado de casi todo en el sistema.

Si seleccionamos una métrica, podemos observar el estado histórico y actual de la misma.

3. Listas de observación

Esta pestaña nos permite monitorear los relojes que hemos creado. Los relojes son umbrales para las métricas que nos muestran si la métrica está en un estado saludable, de advertencia o en peligro.

Watchlists image
Watchlists image

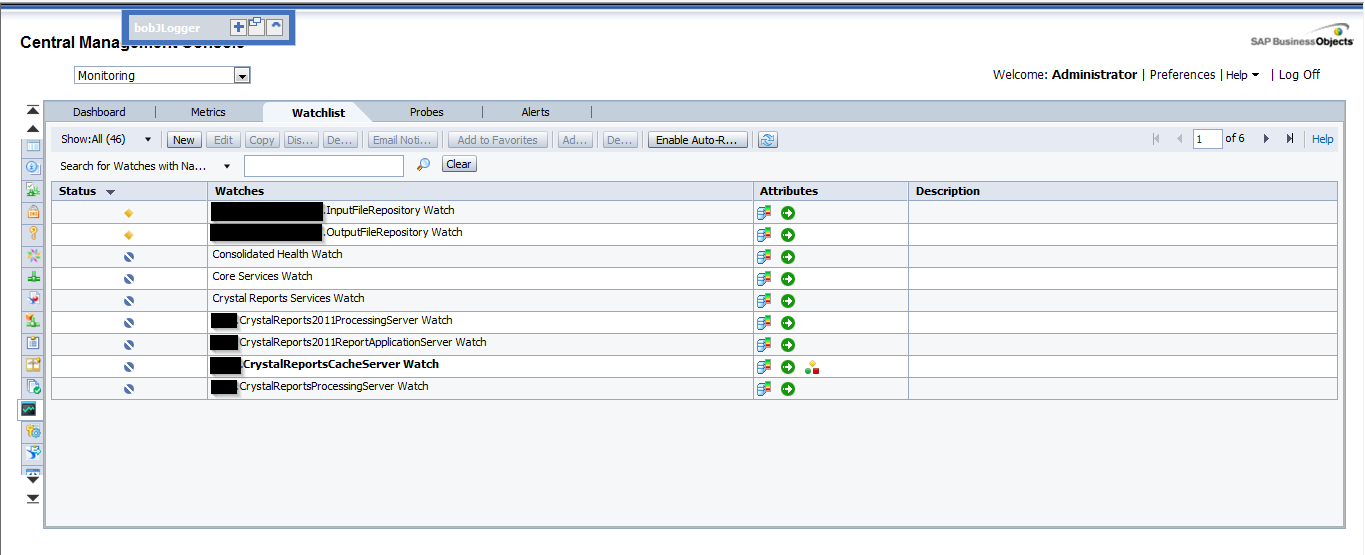
Una vez más, hemos creado relojes por defecto. Podemos cambiar estos umbrales para adaptarlos a nuestro sistema. Además, podemos crear notificaciones a los relojes, por lo tanto, podemos pedirle al reloj que envíe un correo electrónico si el sistema está en peligro, por ejemplo. Hay un montón de opciones interesantes con los relojes. Les animo a probarlos por ustedes mismos.

Finalmente, podemos decidir cuáles son los relojes que queremos ver en la pestaña del tablero de instrumentos.

4. Sondas

Nos proporcionan la capacidad de monitorear nuestro sistema SAP BusinessObjects, utilizando flujos de trabajo de aplicaciones simuladas que se ejecutan a través de scripts basados ​​en SDK.

Probes image
Probes image

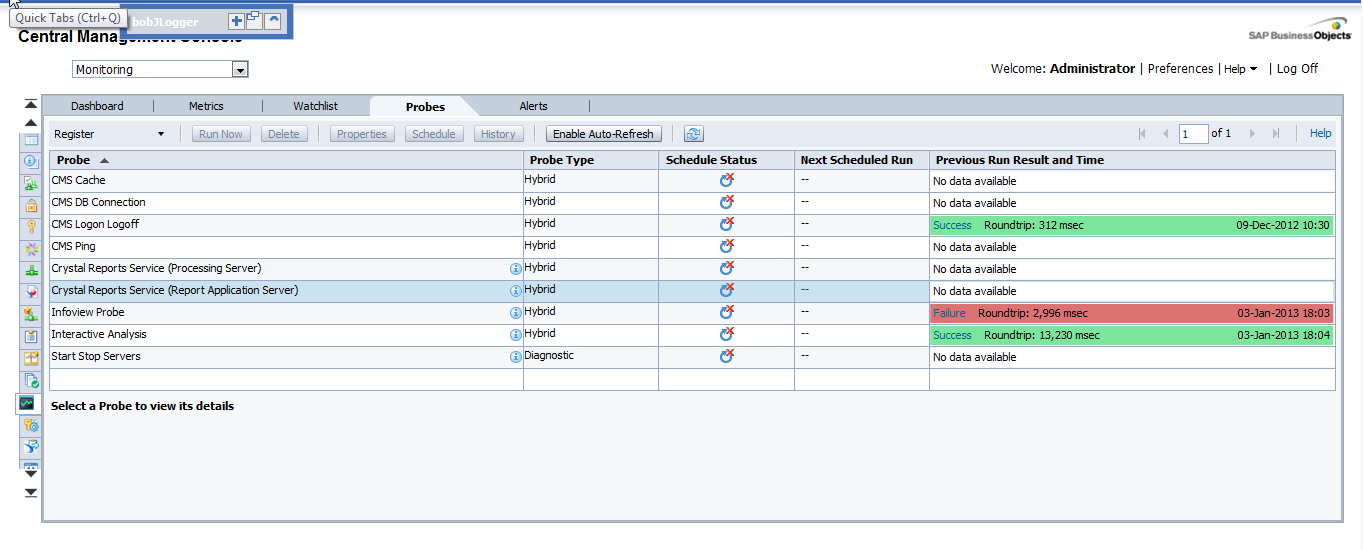
Esta es la parte más interesante del monitoreo del CMC pero, al mismo tiempo, el más difícil. Como podemos crear sondas con un SDK, el poder de esta pestaña es enorme. Podríamos crear lo que queramos, pero no es muy fácil crear estas sondas. No hay ejemplos alrededor de la red o son muy difíciles de encontrar. (Voy a tratar de agregar otra entrada en este blog en el futuro con un ejemplo).

As I mentioned before, the system will provide default probes. We can choose among 9, which are:

  • Sonda de inicio de sesión de inicio de sesión de CMS: supervisa si un usuario puede iniciar sesión con éxito en el sistema SAP BusinessObjects y cuánto tiempo tarda.
  • Servicio Crystal Reports a través de la punta de prueba Page and Cache Server: supervisa la disponibilidad y el rendimiento del servicio Crystal Reports (a través de los servidores de página y caché).
  • Servicio de Crystal Reports a través de la sonda de Report Application Server: Supervisa la disponibilidad y el rendimiento del servicio Crystal Reports (a través de RAS).
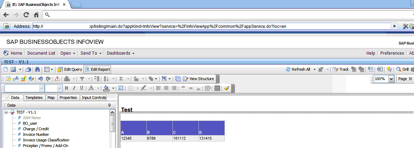
  • Sonda Infoview: supervisa la disponibilidad y el rendimiento del inicio de sesión / cierre de sesión de la aplicación web InfoView.
  • Sonda de supervisión del servicio de Web Intelligence: comprueba la disponibilidad y el rendimiento del servicio Web Intelligence a través de los servidores de informes.
  • Sonda Ping de CMS: Comprueba la funcionalidad principal del CMS.
  • CMS Cache probe: Comprueba la disponibilidad de la caché CMS.
  • Sonda de conexión de base de datos de CMS: prueba la conexión con el repositorio de CMS.
  • Iniciar y detener servidores: prueba para iniciar y detener los distintos servidores del sistema.

5. Alertas

Aquí es donde aparecerán todas las alertas que hemos configurado en la lista de seguimiento.

Alerts image
Alerts image

Esta es una lista de las alertas que el sistema plantea. Podemos ver los diferentes detalles de las alertas al hacer clic en ellos. Estas alertas también pueden enviar correos electrónicos y realizar acciones, dependiendo de lo que hemos establecido en la lista de seguimiento.

Cómo usar todo en uno

Con toda la información anterior, he explicado una visión general de las diferentes pestañas de la supervisión y también lo que podemos hacer con cada una de ellas.

Si queremos aprovechar todo el potencial, es fácil ver que todas las pestañas están conectadas y necesitamos usarlas todas. Un buen ejemplo podría ser el seguimiento del tiempo de respuesta para abrir un informe en el sistema. Para ello, utilizamos la detección "Web Intelligence Service Monitoring" que inicia sesión y tratamos de abrir y actualizar un informe en Web Intelligence. Después de esto, usamos la métrica del tiempo que lleva al sistema ejecutar la sonda y la métrica que dice si la sonda fue exitosa o no. Además, creamos un whatchlist con esta métrica y si las sondas tardan más de 5 segundos, enviará un correo electrónico informando al Administrador que el sistema está funcionando un poco lento y si la sonda falla o tarda más de 15 segundos , Enviará otro correo electrónico informándole que el sistema no funciona correctamente. Podemos programar esta sonda para que se ejecute diariamente.

Con este escenario simple somos capaces de detectar cualquier problema en el sistema automáticamente, antes de que cualquier usuario lo informe. Además, las alertas de las pestañas nos mostrarán si hay algo malo que no habíamos notado antes.

Conclusión

Como conclusión, podemos ver que al jugar con todas estas características, podemos lograr cosas realmente interesantes y obtener la mayoría de todo bajo control en nuestro sistema BO. Podría parecer difícil de aprender, pero hay muchas cosas que podemos hacer sólo con la configuración predeterminada. Después de acostumbrarse a ellos, es hora de jugar con el poder de las sondas auto-creadas y agregar más opciones personalizadas a nuestro monitoreo.

Espero que esta introducción al monitoreo le haya ayudado a entender un poco más cómo CMC Monitoring funciona en SAP BO 4 SP4.

Si tiene alguna pregunta o sugerencia, por favor deje un comentario a continuación.

Uso de una aplicación Java como fuente de información con SAP Data Services

After my post on how to Utilice las bibliotecas SDK de Data Services para construir AWTableMetadata en una aplicación Java, in this post I will explain how to access a JAVA application as a source of information by using the WebService DataStore in SAP Data Services.

To do this we need:

  • Tomcat Server (where our service will be allocated Tomcat 6 BI4)
  • Axis2 Library (1.6.2)
    • Standard Binary distribution/zip
    • WAR distribution/zip
  • Eclipse (To construct our web Service)
  • Data Services Sp3


1. Building the web Service

Step 1: Unzip the the Axis2 WAR distribution inside of the folder…SAP BusinessObjectsTomcat6webapps replacing the actual Axis2 folder by default.

Step 2: Unzip the binary distribution of the Axis2 into a folder called Axis2 (C:Axis2axis2-1.6.2).

Step 3: Set system AXIS2_HOME variable. Go to Control panel -> System -> Advance System settings-> push the Environment Variables button and create the new one with this specification:

Step 4: Set up CATALINA_HOME variable. This is where the Apache Tomcat folder will be located. Go to Control panel -> System -> Advance System settings-> push the Environment Variables button and create the new one with this specification:

Step 5: Restart the Tomcat 6 Server. (turning off our BI4 installment during this process is recommended)

Step 6: Inside Eclipse right click to export our java application into a JAR File.

Step 7: Set the Export destination to the follow path:

 …SAPBusinessObjectsTomcat6webappsaxis2WEBINFservicesOURPROJECT.aar

 Where “OURPROJECT.aar” will be the name of our web service with .aar extension.

Step 8: Restart the Tomcat. Once Tomcat has started we have to access to this path http://localhost:8080/axis2/services and we should see this window:

Step 9: Click on our service in this case Clariba_SMT. We will redirect to the following URL:

http://localhost:8080/axis2/services/Clariba_SMT?wsdl

Copy this URL into a notepad for setting the Web Service Data Store.


2. Setting the Web Services Data Store in Data Services

Step 1: Open the Data Store perspective and right click with the mouse and select New.

Step 2: Set the new name of our extractor as “WS_ClaribaSMT” and then put the URL where our web service is located. Data integrator needs the WSDL descriptor so we put http://localhost:8080/axis2/services/Clariba_SMT?wsdl

Step 3: Import the functions from the webservice that we are going to use. We select in this example“getTableTweeetsEN” for English and “getTableTweeetsES” for Spanish language.


Conclusión: Now we are ready to use our Web service as a Function Call inside a transformation in a Data Services Data Flow. Keep in mind that our Java Application has to return a type of value that Data Services can interpret easily for example a Table (See my past blog for more information). Subsequently we have to do a special set of transformations to interpret the information of the Web Services, which I will cover on my next post.

If you have any related tips or suggestions, please leave a comment below.

¿Cómo abordar un proyecto de Social Media Analytics?

In previous occasions we have dedicated blog posts to the Social Media analytics topic, however we still had not written about which are the most common questions our projects must answer or which are the objectives we should aim for when we plan to extract insights from a Social Media network.


What you should deliver

Last year, SAP gave a series of webinars focused on Social Media (that you can find here if you have a valid SAP user) where they shared some interesting ideas about what a social media project should deliver to a customer. As consultants, we put a great portion of our efforts in endorsing our projects with as much value as possible, which was one of the topics discussed in these webinars. From them I extracted 4 principles that we should try to align our projects with in order to accomplish our goal of delivering value from Social Media analytics.

  • Speed: Social Media analytics must enable the customer to solve challenges faster through a comprehensive understanding of the technologies and experts related to their business. On the other hand, in a world where we have 6000+ tweets per second in average (source: https://twitter.com/TPS_watcher) there is a lot of information to analyze and not enough time to digest all of it, so we have to make sure that whatever our customer is analyzing from their social networks we are able to do faster!
  • Impact: The data that you extract and produce needs to give the necessary information to the customer to enable them to drive higher quality outcomes and build a reputation among their targets in the social networks. If you know what your target is hungry for, the easier it gets to satisfy their needs. Your analytics must be capable of making the customer understand how much they stand out and to monitor their presence in the social networks.
  • Insight: This principle is also related with the above in the sense that when your customers are constantly listening to what experts in their industry are talking about, they could benefit from that collective wisdom to innovate and differentiate themselves from other competitors. It is not just a matter of gathering data, it is also necessary to gather knowledge and trends. It also comes without saying that this also applies to monitoring what your customers' prospects are saying, an accurate and timely understanding of their needs or opinions, increases your customer’s probabilities of delivering what they want.
  • Eficiencia: With all the information that you deliver from the Social Media analytics, you can make it possible for your customer to reduce time and investments spent in the monitoring of their Social Media activity. You should deliver with a server in minutes (why not in real-time?) what several brains take to process in many hours of work.

What you should be asking

One of the main risks of these projects is that it is very easy to lose yourself in the gigantic amount of information that you can extract, so from the very beginning you have to determine the main questions that your customer wants answered and solely focus on them. In my opinion, the most common key points that you should always look for are:

  • Who are the business influencers and what are they talking about?
  • What is the competition doing and how are they using their Social Networks? How big is their impact compared to your customer's?
  • Which are the Social Media networks that are best suited for your customer's needs?  Are they being used enough?


What are the benefits for your customer

Now, imagine yourself in a position where you have to sell the key benefits to a potential customer. He does not want to hear the whole “Social Media is the future” speech, he just wants you to get to the point… If your project can deliver these points below, you will be indubitably in good shape:

  • Discover key business influencers and reach them
  • Design effective strategies assessing the competition’s activities
  • Understand if the message sent to the target has good visibility

If you have any questions or anything to add to help improve this post, please feel free to leave your comments. You may also find other interesting articles related to this topic in our blog here.

Proporcionar datos de SSM a herramientas de generación de informes de SAP BusinessObjects - Exhausting all scenarios

In the last two months I have been in a couple of customers who were interested in the integration of SAP Strategy Management 10.0 with SAP BusinessObjects BI Platform 4.0. In this post I would like to explain what that integration is about.

First of all, a brief introduction about the solution. The SAP Strategy Management (SSM) software allows aligning the Strategy Plan of the company and its key objectives and spread it across all the organization. It is an out of the box Enterprise Performance Management solution in which you can insert the most important KPIs of your company in Balanced Scorecards or Strategy Maps and control their performance in relation to the Strategy of the company. Within SSM you can also create initiatives to implement improvements or corrective actions and link them to the objectives or KPIs.

Sometimes the customer has requirements to implement reports or further analysis on top of SSM and these cannot be covered with the standard functionality of the solution. In that case, the best option is to implement the integration between SSM and SAP BusinessObects reporting tools. Some examples of what you can do with that integration:

  • Implementar paneles de medida a medida con los KPI y objetivos de SSM
  • Implementar universos y permitir a los usuarios explotar información de SSM con Web Intelligence sin consumir licencias SSM adicionales
  • Implemente Crystal Reports perfectos en la parte superior del SSM
  • Fomentar la propiedad con Publicaciones. Por ejemplo, envíe una lista de KPI que no están funcionando bien a sus usuarios responsables

Para implementar dicha integración, puede seguir la guía de configuración de SAP SSM. Sin embargo, en algunos casos, hay falta de documentación y hay que hacer cosas fuera del script. En otros casos, la documentación existente no se ha actualizado todavía a BI 4.0 y SSM 10.0. Y finalmente, a veces la documentación es incorrecta o el software tiene errores y no se puede configurar la integración.

En este post analizaremos los siguientes escenarios:

  1. Informes de Web Intelligence sobre los modelos SSM
  2. Informes de Web Intelligence sobre un modelo de datos SSM (solución desarrollada por Clariba)
  3. Crystal Reports en la parte superior de SSM (explorando diferentes opciones)
  4. Dashboards en la parte superior de SSM (explorando diferentes opciones)

Estos escenarios se han implementado con los siguientes componentes de software:

  • SAP NetWeaver 7.3 SP08
  • SAP SSM 10.0 SP06
  • Plataforma de BI de SAP BusinessObjects 4.0 SP05
  • Informes de Crystal 2011 SP05
  • Cuadros 4.0 SP05

1. Informes de Web Intelligence sobre un modelo SSM

Según la documentación de SAP, podemos configurar el proveedor de ODBO para construir un Universo en la parte superior de los modelos SSM. El problema es que todavía tenemos que usar el Diseñador de Universo en lugar de la Herramienta de Diseño de Información del BI 4.0. A continuación se indican los pasos para configurar el proveedor ODBO e implementar su primer informe en la parte superior del SSM:

  • Vaya a su servidor BO 4.0 y asegúrese de tener un Servicio de Análisis Multimensional en el servidor BO. Detenga el servidor MDAS y el servidor de conexión en el Administrador de configuración central
  • Copie la carpeta ODBOProvider de la ruta : Archivos de programa (x86) SAP BusinessObjectsStrategy ManagementInternetPub de su servidor SSM al servidor BO
  • En el servidor SSM, ejecute el archivo SSMProviderReg.bat en el servidor BO. Asegúrese de tener derechos de administrador en el servidor BO. Una vez completado, compruebe en el regedit que es capaz de encontrar el registro SSMProvider. 1 en el registro de Windows
  • Modifique el registro de Windows para insertar la cadena siguiente en esa ruta (suponiendo que está utilizando una ventana de 64 -bit): HKEY_LOCAL_MACHINESOFTWAREWow6432NodeSAPSSMODBOProvider "servletUri" = "/ strategyServer / ODBOProviderServlet"
  • Acceda a la siguiente ruta en el servidor BO: : Archivos de programa (x86) SAP BusinessObjectsSAP BusinessObjects Enterprise XI 4.0 dataAccessconnectionServeroledb_olap

Gestión de estrategias 10.0

dbd_sqlsrvas

SAP BusinessObjects

Sqlsrv_as2005, sqlsrv_as, oledb_olap

SSMProvider. 1

  • Inicie el servidor MDAS y el servidor de conexión
  • Ahora podemos ir al Universe Designer y empezar a implementar un Universo en la parte superior de nuestro Modelo. El primer paso es definir la conexión. En la lista de conexiones (recuperada del servidor de conexión) podemos ver ahora el nuevo registro que hemos insertado, Strategy Management 10.0:
  • Defina los parámetros de conexión. Debe ser un usuario SSM con los permisos adecuados y debe informar a la dirección completa del servidor (FQDN) y su puerto.
  • Una vez conectado al servidor SSM, verá la lista de cubos disponibles. La categoría AS permite acceder a las medidas (basadas en atributos y dimensiones) en el modelo de Application Server. El adaptador SM permite el acceso a la dimensión de la estrategia, que representa las dimensiones de gestión de la estrategia Scorecard e Iniciativa. No se presentan los detalles del Scorecard que no estén relacionados con el KPI, tales como los comentarios.
  • Y finalmente veremos nuestro universo con las dimensiones disponibles, las clases estándar (Time y Scorecards) y las medidas. Puede mostrar los nombres técnicos de los objetos como detalle o puede definir jerarquías de Perspectivas, Objetivos y KPIs.
  • Ahora podemos publicar el universo e ir a la Web Intelligence para comenzar a implementar nuestros informes sobre los modelos SSM.

2. Informes de Web Intelligence sobre el modelo de datos SSM

Esa es una solución que puede implementar si tiene un conocimiento avanzado del modelo de datos SSM. Puede implementar un Universo UNX con la Herramienta de Diseño de Información enlazando todas las tablas de la Entrada y Aprobación, los Nodos del Scorecard, el Creador de Cubos o las Iniciativas. Las ventajas de esta opción son que tiene acceso a información adicional no disponible en el Cubo de SSM, como las Iniciativas, los usuarios relacionados con los KPI específicos, los atributos de los KPI, etc.

If you are interested in such an option, please, contact us. Keep in mind that it is not a supported option from SAP but we have implemented it many times and we know it works.

3. Crystal Reports on top of SSM

La integración de SAP Crystal Reports con SSM se puede realizar de 4 maneras diferentes:

  • Implementación de una consulta como un servicio Web desde el universo, construido en pasos anteriores: hemos logrado implementar ese escenario
  • Conectando Crystal Reports al Universo encima de los Modelos SSM que hemos construido en el primer paso: ese escenario no funciona aunque seguimos las instrucciones de SAP
  • Uso de una conexión OLE DB (ADO): esta opción, no explicada por SAP, está disponible si instalamos el proveedor ODBO pero no hemos logrado que funcione
  • Uso de la conexión OLAP: de acuerdo con la documentación SAP, podemos crear un informe de cubo OLAP en Crystal Reports. Debemos ser capaces de seleccionar la opción de gestión de estrategia en la siguiente pantalla para insertar datos de conexión SSM, pero no hemos podido encontrar esa opción

4. Cuadros de mando que utilizan conexiones de servicios web

Utilizando Dashboards, tiene dos formas diferentes de implementar el acceso a los datos:

  • Implementar una consulta como un servicio Web (QaaWS) para recuperar la información relevante de los universos que habíamos implementado antes.
  • Utilice los Servicios Web disponibles en SAP NetWeaver para recuperar información del SSM: de acuerdo con la documentación SAP necesita descargar el archivo WSDL SMDataServiceService y las aplicaciones CubeServiceService y llamar a las funciones dentro de ellos. Con nuestros Dashboards 4.0 SP05 no hemos podido procesar los archivos WSDL ya que la herramienta no puede cargar la URL.

Resumen

Proporcionar información de SAP Strategy Management a SAP BusinessObjects BI Platform 4.0 puede mejorar las capacidades de su sistema Strategy. Sin embargo, la integración no es tan fácil dada la falta de información sobre ese tema y la calidad de la información existente. Intentamos implementar todos los posibles escenarios de integración y hemos tenido éxito con Web Intelligence y esta es la ruta que recomendamos, ya que los escenarios relacionados con Crystal Reports y Dashboards no funcionaban al usar SSM 10.0 y BI 4.0.

Estaremos siguiendo estos temas y le informaremos si finalmente logramos resolverlos. Si tiene alguna sugerencia o si encontró una solución a estos problemas, por favor deje un comentario a continuación.

Únete a Clariba en el Foro SAP de Omán en marzo 6

Clariba is pleased to sponsor SAP Forum in Muscat. This is the first SAP Forum event to take place in Oman, following the recent opening of SAP offices in the country in 2012 to better serve local clients.

Aimed  at C-level executives, IT decision makers and Business managers, SAP Forum is an unmatched chance to investigate the entire SAP ecosystem in one day, and understand the value it can bring to your business.

At the SAP Forum Oman you will be able to:

      • Network with industry peers
      • Hear about the experiences of SAP customers and how SAP solutions have been helping them run their business better
      • Gain insight from thought leadership keynotes from SAP´s top level management
      • Catch focused presentations on  topics like Rapid Deployment solutions, Cloud, In-Memory, Analytics and Mobility
      • Meet Clariba and other SAP partners at the exhibition area


A recognized SAP Gold Partner, Clariba is a leading SAP Business Intelligence consultancy in MENA and a specialist in SAP BusinessObjects y Savia HANA technologies. You are invited to meet the Clariba team at our booth at the exhibition area. There you will be able to see our dashboard and reporting solutions developed for our clients - leaders in a variety of industries such as telco, banking and oil & gas.

“Clariba is excited to take part in the first SAP Forum Oman, says Marc Haberland, Managing Director of Clariba. “Clariba is already working in Oman and we are thrilled to see SAP investing in the region as well. Come meet us at the Exhibition Zone for insights in innovative Inteligencia de Negocioenterprise performance y information management solutions."


Attendance at the SAP Forum Oman is free of charge. 
Regístrate ahora to secure your place.

Details of SAP Forum Oman

Fecha: marzo 6
Time: From 8:30 a.m. to 4:30 p.m.
Location: Al Bustan Palace, A Ritz-Carlton Hotel, PO Box 1998, Muscat 114 Oman 
Regístrate ahora


Your Invitation to SAP Forum Oman on marzo 6


SAP FORUM, Oman

Join Clariba at the first

SAP Forum in Oman

Regístrate ahora


Marca tu calendario

Fecha: 6 marzo, 2013
Timings: 08:00 – 17:00
Venue: Al Bustan Palace-Ritz-Carlton 
Cost: Free to attend

Find out more ›

We are ready to inspire innovation at the SAP FORUM Oman. This time it is coming to Muscat, Oman on 6 marzo, 2013. Experience the most awaited annual SAP event focused on expanding your technology knowledge, enriching your business value and discovering how SAP solutions can help companies like yours run like never before.Here’s a brief intake on what you can experience at this year’s SAP FORUM:

    Hear from SAP executives and thought-leaders about the latest essential business technology trends and innovations like Mobile, Cloud and Analytics
 
      Participate in highly informative, collaborative panel discussions and breakout sessions, led by today’s leading SAP evangelists and experts who can help you transform the way technological innovation is leveraged for ongoing business value
 
      Gain valuable insights by listening to the real-world experiences of SAP customers who will share their experiences in successfully implementing SAP solutions
 
       Get an in-depth look at future SAP applications that support your growth strategies, create a competitive advantage and provide positive impact for your business
 
      Interact with our Partner Ecosystem in our Exhibition Showcase to experience current SAP-supporting technologies and services

This is your time to network with SAP executives, meet our entire ecosystem in one place and learn how SAP can help companies like yours Run like never before.

Attend our Dubai event - Taking your business to new heights with SAP HANA & Business Intelligence

Taking your business to new heights with SAP HANA & Business Intelligence.

Hands-on experience on how convergence to in-memory, real-time analytics can help accelerate your business.


Regístrate ahora

SAP, Clariba & Fujitsu cordially invite you to learn SAP’s strategy to fast-forward your business to real-time analytics with this session on SAP HANA & Business Intelligence.
You will experience how your end-users can leverage the power of SAP HANA for instant analysis of structured and unstructured data with SAP's leading BI solutions. Furthermore learn how business users can easily extract actionable insight from vast amounts of data with speed-of-thought analytics and predictive analysis
.

Agenda Overview

08:30am - Registration & Coffee Break

09:00am - Welcome & Introduction

09:15am - Where is SAP going with BI? (SAP)

10:00am - Real-Time Data Platform (SAP)

10:45am - Mid-Morning Coffee Break

11:00am - Taking Your Business to New Heights with SAP HANA (Clariba)

11:45am - Introduction to SAP HANA Infrastructure (Fujitsu)

12:30pm - Wrap-Up

12:45pm - Almuerzo

02:00pm - SAP HANA Hands-On Session (HANA Technical Academy) for up to 10 participants* 

We look forward to seeing you there.

* fully booked

Dubai, Emiratos Árabes Unidos

marzo 13, 2013

8:30am - 05:00pm
Radisson Blu Hotel
Dubai Media City

Click here to register

Asista a nuestro Evento - Visibilidad de Negocios en Tiempo Real con SAP BusinessObjects y SAP HANA- Kuwait y Bahrein

.


Real-Time Business Visibility  with SAP BusinessObjects and SAP HANA. Join SAP and Clariba and discover how to gain actionable insights from your Oracle eBusiness Suite and other mission-critical systems.

. . Regístrate ahora

We would like to invite you to learn how to put enterprise-wide data on your Oracle eBusiness Suite (EBS) to use in order to make timely decisions, using SAP BusinessObjects revolutionary real-time processing technology. The detailed agenda for this half-day event is the following: - Registration & networking breakfast: 8:30- Welcome & overview: 9:00

- Real-time business intelligence: 9:15

Demo of Real-time Business Intelligence (BI) dashboard and reports, running in real time

Brief introduction to SAP BI Suite

Discover self-service analytics with Visual Intelligence

- Predictive analytics in real-time: 10:00

Demo of trend and scenario analysis

Decisions on-the-go with SAP BI Mobility solutions

- The real-time technology revolution:10:45

Business case for SAP Real-Time Data Platform (RTDP)

Building a solid data integration strategy

- Coffee & networking break: 11:00 - Taking your business to the next level with SAP HANA for Oracle EBS by SAP Gold Partner Clariba: 11:15

Challenges today (explosion of data, complex data sources, need for agility and rapid deployment of solutions

Business case including demo with Oracle EBS data

Business benefits and time-to-value

Brief talk on abundance of hardware solutions that match any requirement and existing install base

- Best time-to-value with SAP Rapid Deployment Solutions (RDS) by SAP Gold Partner Clariba: 11:45                              

Overview of RDS

Fixed price, fixed time, fixed scope projects

Examples of RDS & benefits to customers

- Wrap up: 12:15                                      - Lunch: 12:30  

Conozca a los expertos durante el almuerzo

We look forward to seeing you there.

Kuwait marzo 4, 2013

Venue: Courtyard Mariott

Time: 9:00am to 2:00pm

Kuwait City, Kuwait

To register click here

marzo 5, 2013

Venue: Ritz-Carlton Hotel

Time: 9:00am to 2:00pm

Manama, Bahrain

To register click here

Para más información

www.sap.com/mena

Uso de Google Chrome con SAP BusinessObjects

Todos sabemos que hay muchos navegadores de Internet disponibles, pero definitivamente Google Chrome es uno de los más utilizados hoy en día y por lo tanto hemos tenido un montón de comentarios de nuestros clientes relacionados con el uso de cromo con SAP BusinessObjects.

Un problema principal encontrado por los usuarios es que cuando se usa Google Chrome en InfoView o BiLaunchPad aparece una pantalla de error de plug-in que falta cuando se intenta modificar un informe y también se muestra una pantalla de error HTTP Status 500 al intentar iniciar sesión SAP BusinessObjects Explorer. En este blog voy a proporcionar una solución a estos problemas.

Problema al iniciar sesión en InfoView o BILaunchPad en GoogleChrome
Problema al acceder a SAP BusinessObjects Explorer

La solución que hemos encontrado es usar un complemento de Google Chrome llamado "pestaña IE", que emula Internet Explorer en Chrome.

Pasos para instalarlo:

  1. From Google Chrome, introduce the link in the url bar and install the add-on.                                                                                       https://chrome.google.com/webstore/detail/hehijbfgiekmjfkfjpbkbammjbdenadd
  1. Una vez instalado verá una pequeña carpeta con el logotipo de IExplorer en la esquina superior derecha de Google Chrome.
Carpeta con el logotipo de Explorer
  1. Haga clic en la carpeta y aparecerá otra barra de URL
Aparece la barra de direcciones URL
  1. Introduzca el enlace Infoview / BI LaunchPad en la nueva barra y comience a trabajar con ella.

Además, en caso de que necesites hacer clic en un vínculo Abrir documento y quieres que Google Chrome se abra automáticamente con él, necesitarás agregar la URL de tu servidor para que se abra correctamente, para ello debes seguir estos pasos:

  1. Haga clic derecho en la carpeta pequeña con el logotipo de IExplorer
  1. Elegir opciones
  1. Agregar el texto de la dirección del servidor en el campo URL automático

El resultado

Las aplicaciones basadas en la Web de SAP BusinessObjects se pueden utilizar con Google Chrome con éxito, consulte los siguientes ejemplos:

Modificación de un informe en InfoView
Visualización y gestión de espacios desde SAP BusinessObjects Explorer

Resumen

Los principales beneficios de la aplicación de estos consejos son, con la ayuda de Google Chrome:

  • Modificar documentos en Infoview / BILaunchPad
  • Iniciar sesión y administrar espacios en SAP BusinessObjects Explorer
  • Aumente la velocidad de navegación mientras pasa por las carpetas de la plataforma

De acuerdo con el PAM oficial de SAP (Matriz de disponibilidad de productos), Google Chrome no es totalmente compatible debido a su velocidad de desarrollo rápido, por lo que el uso y actualización frecuente de este complemento es muy recomendable.

Hope this will help you have a better experience when working with SAP BusinessObjects. If any doubts or suggestions please leave a comment below.

Cómo configurar la conectividad de SQL Server para WebI desde SAP BusinessObjects BI4. 0 en Linux

Hoy en día hemos notado que algunos de nuestros clientes están siguiendo la tendencia de los productos de código abierto. De hecho, Linux es una gran opción de sistema operativo debido a que es totalmente compatible con SAP BusinessObjects BI 4 y también ayuda a las empresas a reducir costos. Sin embargo, Linux ha conservado la forma en que funciona el clásico sistema operativo Unix y por lo tanto todo se trata de derechos y comandos por lotes. Por lo tanto, un conocimiento técnico Linux avanzado es obligatorio antes de entrar en él.

El propósito de esta entrada de blog es compartir los problemas que enfrentamos en uno de nuestros clientes que ejecutan SAP BusinessObjects BI4 SP4 en una versión de Red Hat Enterprise Linux Server 6.3 usando MySQL 5.1. 61 como base de datos del sistema y cómo Los resolvió.

The issue came out when right after a production database migration (a brand new SQL Server 2008) all their WebI documents stopped running from the SAP BI4 Launchpad with an unusual error "Database Error .[ (IES 10901)" blocking every single WebI to run and the whole core business was jeopardized. Rich Client did not experience any problem in Windows. After the first analysis, we discovered that default SQL Server ODBC driver installation was only configured properly for 32bit connections in the Linux server whereas WebI requires 64bit ODBC driver connectivity for running in the SAP BI4 Launchpad.

When it came to this point we had to apply a couple of OSS notes. The first one was OSS 1607125 "How to configure SQL Server connectivity for WebI from a BI4.0 unix environment". Resolution is:

1. Abrir env.sh bajo / Sap_bobj / setup /

2. Busque la línea siguiente

$ LIBRIR: $ LIBDIR32: $ WCSCOMPONENTDIR: $ PLUGINDIST / auth / secEnterprise: $ {CRPEPATH64}: $ {CRPEPATH}: $ {MWHOME}: $ PLUGINDIST / desktop / CrystalEnterprise.Report: $ {BOBJEDIR} enterprise_xi40 / $ SOFTWAREPATH32 / ras: $ {BOBJEDIR} mysql / lib "

3. Modifique la línea anterior agregando lo siguiente

": $ {BOBJEDIR} enterprise_xi40 / linux_x64 / odbc / lib: $ {BOBJEDIR} enterprise_xi40 / $ SOFTWAREPATH32 / odbc / lib"

La línea debería verse así

LIBRARYPATH="$LIBDIR:$LIBDIR32:$WCSCOMPONENTDIR:$PLUGINDIST/auth/secEnterprise:${CRPEPATH64}:${CRPEPATH}:${MWHOME}:$PLUGINDIST/desktop/CrystalEnterprise.Report:${BOBJEDIR}enterprise_xi40/$SOFTWAREPATH32/ras:${BOBJEDIR}mysql/lib:${BOBJEDIR}enterprise_xi40/linux_x64/odbc/lib:${BOBJEDIR}enterprise_xi40/$SOFTWAREPATH32/odbc/lib”

4. Navegar a Sap_bobjenterprise_Xi40

5. Abra el archivo odbc.ini utilizando vi u otras herramientas del editor de texto.

6. Busque la entrada para Sql Server DSN. La entrada DSN predeterminada en odbc.ini se denomina "[SQL Server Native Wire Protocol]", pero se recomienda crear su propia entrada DSN utilizando los mismos parámetros especificados en el DSN predeterminado.

7. Actualizar la sección "Controlador" del DSN para que apunte a 64 versión de bits de los controladores ODBC de SQL Server

Driver=<install directory>/sap_bobj/enterprise_xi40/linux_x64/odbc/lib/CRsqls24.so

8. Reinicie el SIA

However the issue was not resolved completely. We received a new error with the following description whenever we tried to run a WebI "Receive the error : Database error: [DataDirect][ODBC lib] System information file not found. Please check the ODBCINI environment  variable.. (IES 10901) (WIS 10901)". This is a configuration issue on the Linux operating system with the environment variable ODBCINI.  Please make sure your environment variables are set correctly according to OSS note 1291142 - "Web Intelligence reporting using DataDirect drivers in Unix" (as of today it still applies to BI4). Resolution is:

1. En el perfil Unix del usuario Bobje, agregue / modifique las siguientes variables de entorno y genere el perfil

BOBJEDIR = / odbc export ODBC_HOME ODBCINI = $ BOBJEDIR / odbc.ini exportación ODBCINI LD_LIBRARY_PATH = $ BOBJEDIR / enterprise120 / / dataAccess / RDBMS / connectionServer: $ ODBC_HOME / lib: $ BOBJEDIR / enterprise120 / /: $ LD_LIBRARY_PATH exportar LD_LIBRARY_PATH

NOTA: Reemplace con linux_x86, solaris_sparc, aix_rs6000, hpux_pa-risc, dependiendo de su plataforma específica de Linux. NOTA: Debe establecer / exportar las variables env anteriores en el mismo orden que se muestra.

Asegúrese de utilizar el archivo $ HOME / .odbc.ini como su fuente predeterminada para la configuración de ODBC. Por lo tanto, modifique la variable ODBCINI de la siguiente manera:

ODBCINI = $ HOME / .odbc.ini exportación ODBCINI

2. Modifique el odbc.ini para agregar el DSN

                  [TestDSN] Controlador = / enterprise120 / /odbc/lib/CRmsss23.so Descripción = DataDirect 5.3 Dirección del controlador de protocolo de cable de SQLServer = , Base de datos = QuotedId = Yes AnsiNPW = No

NOTA: Su nombre DSN (TestDSN) debe ser el mismo nombre DSN que utilizó al crear la conexión ODBC en Windows

3. DataDirect proporciona tanto controladores OEM como OEM

Los controladores proporcionados por BI4 son controladores OEM. Básicamente, el WebI depende del ConnectionServer. De forma predeterminada, ConnectionServer está configurado para utilizar controladores NO OEM. Por lo tanto, hemos editado el servidor de conexión para permitir el uso de la marca OEM DD controlador. Los pasos son:

  • Haga una copia de seguridad de $ BOBJEDIR / enterprise120 / /dataAccess/RDBMS/connectionServer/odbc/odbc.sbo
  • Abra odbc.sbo con VI, busque DataDirect, hay 4 entradas una para cada servidor MSSQL que apoyamos.
  • Cambiar todo 4 de No a Sí

 4. Detenga todos los servidores XI

Ejecute ./stopservers, salga completamente de su shell unix y vuelva a iniciar sesión (para asegurarse de que se han configurado nuevas variables de entorno), vuelva a iniciar todos los servidores BI4.

After applying the OSS note we were able to retrieve data from SQL Server 2008 refreshing our WebI documents, however we noticed that CPU was reaching 100% every time we used a WebI in any way. Going through the log files we found errors such as "MS SQL Server 2008 |JobId:61340512 |EXIT SQLGetDiagRec with return code -1 (SQL_ERROR)" .

We took a look at the odbc.ini file and we found out that QWESD entry that was not initially there somehow appeared. As long as we were copying the information from an existing datasource we didn't need it all and we decided to remove the QEWSD= from the ini file.

Finally double check that Yes located at sqlsrv.sbo file in /opt/bi40/sap_bobj/enterprise_xi40/dataAccess/connectionServer/odbc is set to Yes.

Esperamos que nuestra experiencia sea un enfoque rápido de solución de problemas para usted. Si tiene algún consejo o sugerencia para mejorar este artículo, por favor deje un comentario a continuación.

EspañolEnglish