""

Haciendo la paz con el enemigo: SAP BusinessObjects Live Office XI 4.0

El escenario más común al que me he enfrentado hasta ahora, después de algunos años dando presentaciones de preventa de BI e implementando sistemas de BI para clientes, ha sido el de reunirme con miembros de un departamento de TI sobrecargado que dirigen sus esfuerzos para desarrollar informes complejos con Herramientas de BI para un grupo de usuarios empresariales que, al final, simplemente exportarán la información que se les entregó a una hoja de Excel y trabajarán directamente en ella.

For decades, most BI vendors have tried to convince users to give up Excel sheets and instead work with more flexible and user friendly BI tools. But it’s an acknowledged fact that nowadays millions of people around the world use spreadsheets on a daily basis. The time has come for vendors to take off their blinders and to act upon what is happening. Already some have been readjusting their strategies and roadmaps, and have shifted towards accepting Excel as a presentation layer for data thereby providing the necessary integration with it.

This article is about how SAP BusinessObjects tackles this challenge and goes one step further in terms of tools integration thanks to the new features of the latest release XI 4.0.

With Live Office, it is possible to insert content from Web Intelligence, Crystal Reports and also Universe Queries directly into Microsoft Office documents (PowerPoint, Word, Excel or Outlook). Furthermore, when opening the very document at a later time, it is possible to refresh the embedded objects and retrieve up-to-date data in the document.

This is truly an advantageous solution and I have had the opportunity to use this technology with some customers, who continue employing their traditional form of reporting with an Excel sheet but can now combine this with error-free data obtained directly from their business systems.

In the latest release of Live Office, a new functionality loads the data selection of Microsoft Excel to SAP BusinessObjects Explorer, a flash-based tool that allows further analysis in a very visual and intuitive way. Moreover, the results from a completed analysis can also be downloaded to other applications, such as Outlook and PowerPoint to further the study or to simply send by email.

Live Office XI 4.0

If you have any questions regarding Live Office XI 4.0 and its uses in a customer environment, feel free to leave a comment and I will follow up with you.

SAPPHIRE NOW Connects to SAP World Tour Events in Four European Cities

SAP AG will host its annual conference, SAPPHIRE NOW, in Orlando, Florida, from mayo 15 - 18, 2011. Building on a record 2010 attendance of 50,000 customers, partners and employees on-site and online, SAP will connect this year’s conference to four regional events in Europe. Delegates to SAP® World Tour stops in London; Moscow; Brussels, Belgium; and Lausanne, Switzerland, will have the opportunity to meet with SAP executives from regional leadership teams and local customers and partners to discuss the product and technology updates being presented at the event. Attendance at the four events, which take place on mayo 18 (mayo 17 - 18 in Lausanne), is expected to exceed 3,000.

Cómo organizar una reunión entre dos parientes que no se conocen entre sí: conectando Strategy Management con Data Services

As promised in our previous SSM article, I will now walk you through another interesting objective we have achieved while working on our SSM project: populate Strategy Management KPIs with a Data Services job.

Currently SAP BO SSM does not provide a connector to SAP Business Objects tools even if both SSM and Data Services are SAP BusinessObjects products.

The solution we designed for our customer in UAE provides them with the option of loading the data from any source into SAP BO Data Services and of finally dumping the values into an SSM PAS Cube (via E&A PAS schedule).

The solution recommended by SAP for its latest version currently in use, SSM7.5 SP08, allows loading the data into the PAS cube by creating an IDQL script.

The concerns we were faced with in our project were related to the actions required for the maintenance of IDQL (scripting language).

For a non-trained customer, IDQL sounds like a black box and sets off many alerts especially when it comes to maintenance.

I was caught in the midst of a question storm which ended thanks to our “problem solving attitude” and rapidly blew off all questions.

It didn’t take us long to learn how the SSM data model works for the KPIs as we had already studied them while working on the initiative.

The first step taken consisted in creating a cube in the SSM “Cube Builder” console. From here we proceeded to mapping the KPIs ID that we have in SSM SQL and in our original source (i.e. ERP, Excel, and Other DBs).

The process of creating a source and sending it out with a data integrator was a straightforward and pleasurable task and has delivered great results.

Now, this solution allows me not only to insert the current data but to introduce the historical data just as well, it’s absolutely fantastic!!!!

I was able to visualize in my “Entry and Approval” panel the data I was inserting on an excel file and on the ERP tables.

At this point my data was not added into the “Balance Scorecard” yet, so the last action I had to perform was that of publishing those values.

I used the “Entry and Approval” scheduler that was running right after the ETL job.

Reached this stage, I had my SSM Context populated with my values.

In the image displayed below I have outlined the steps we followed (IDQL is marked in red since it hadn’t been utilized throughout this process) and as you can clearly notice, we are now capable to create reports and dashboards from the SSM Database by generating a universe on top of the SSM tables. 

Integrating SSM with Data Services

  Please don’t hesitate to contact us at info@clariba.com for more information about this article or for SSM consultancy.

Coser las iniciativas en la demanda estratégica de un cliente (con SAP SSM 7.5)

All through my ongoing project in Abu Dhabi, I have never turned down any of the challenges that arise while working with my customer. The project in question involves the customer looking through the tools I propose as if they were a collection of nice suits, but all in the wrong size.

En esta etapa, debemos proceder como lo haría un sastre: no podemos presumir que nuestro cliente va a perder / aumentar el peso para ajustarse a la ropa que queremos coser para ellos, sino que necesitamos ajustar el atuendo aquí y allí hasta que obtengamos el ajuste perfecto para nuestro cliente.

Nunca pensaríamos en recomendar una dieta y ciertamente no agregaríamos más puntos a su atuendo. Hoy, lo más apremiante es que hablamos sobre la estrategia de nuestros clientes y cómo adaptar SAP Strategy Management (SSM) a las necesidades de nuestros clientes.

Una de las solicitudes que he recibido está relacionada con la implementación de las Iniciativas.

Pero, ¿qué significa "Iniciativa"? Según los expertos en gestión estratégica Kaplan y Norton, "una Iniciativa organiza personas y recursos y dicta qué actividades son necesarias para lograr un objetivo específico en una fecha determinada; las iniciativas proporcionan el cómo, mientras que las metas proporcionan el qué".

Durante una presentación de demostración de SSM, mientras ilustraba las propiedades de las Iniciativas, mi cliente me preguntó: "¿Qué pasa si la Iniciativa depende directamente del logro del último hito? ¿Qué sucede si quiero considerar una Iniciativa como verde (ok) incluso si el primer hito no se logró a tiempo pero el resto se cumplió antes de lo previsto? "

Como siempre, la respuesta más rápida y fácil sería "no es posible", pero nuestra mentalidad de ventas convierte automáticamente esa respuesta en "no es una solución lista para usar provista por la herramienta". No importa cómo lo exprese, el cliente quiere escuchar que "es posible".

Which answer did I give to the customer? Well, whatever I said, now the customer knows that it is possible to configure the Initiatives as sequential.

Así que veamos qué hicimos para crear nuestras Iniciativas secuenciales y no secuenciales (basadas en hitos secuenciales / no secuenciales).

Initiatives (sequential milestones, not sequential milestones)

  • Sequential Milestones: The status of the Initiative needs to be synched up with the status of the last Milestone. The status of the other milestones will not affect the schedule status of the Initiative (i.e. the delay of the milestone does not mean a failure of the Initiative whether or not the last milestone will be achieved on time).


  • Non sequential Milestones: The status of the initiative will be set as not achieved even if only one of the milestones has not been achieved. Out of the box solution with SSM.


Reglas de validación

  • Los valores de los hitos no pueden no tener sentido según la entrada del usuario. Es decir, 40% completado sin establecer una fecha de finalización o 100% completo sin fecha de finalización (2 caso más aceptable).

La gran pregunta que surge después de haber explicado lo que resolvimos es: "¿cómo lo resolvimos?" Básicamente, logramos interactuar con las tablas de SSM cuando se crea una nueva Iniciativa (basada en reglas).

General Rules: We manage the percentage and the end date of the milestones to avoid the following scenarios:

  • Hito 100% completado sin establecer una fecha de finalización: complete la fecha de finalización con la fecha real si el porcentaje es igual a 100%.
  • Hito <100% completado con una fecha de finalización ya establecida: cambie automáticamente el porcentaje a 100% tan pronto como se establezca una fecha de finalización.

Sequential Initiatives:

  • El usuario debe escribir la palabra "@Secuencial" al comienzo de la descripción de la Iniciativa. La herramienta aplicará automáticamente las reglas definidas por nuestro cliente y por nosotros.
  • Aplicamos una fecha de finalización a la Iniciativa y un color de estado basado en los resultados del último hito.

Non-Sequential Initiatives:

  • El usuario puede escribir una descripción diferente a "@Sequential" y SSM se comportará automáticamente como está listo para usar.

Esta solución agrega valor a la Gestión estratégica y ayuda a nuestros clientes a sentirse más cómodos con un traje que se adapta a sus necesidades. Esta solución se puede aplicar a las instalaciones del servidor SQL, MaxDB u Oracle.

For more information/consultancy on this or any other custom solution with SSM, please contact us at info@clariba.com

Loading Status Animation in Xcelsius

A menudo, al desarrollar un panel de control con Xcelsius, tenemos conexiones a una base de datos, ya sea con LiveOffice o QaaWS (Query as a Web Service). Esto nos deja con solo dos opciones para actualizar nuestro panel de control: ya sea que procedamos una vez que todos los componentes de Xcelsius estén cargados o, alternativamente, cambiemos un botón de radio, un cuadro combinado o cualquiera de los componentes relacionados con los objetos de conexión. En ambos ejemplos, cuando tenemos que administrar grandes cantidades de datos, normalmente esperamos hasta que la conexión devuelva nuestra solicitud. Esto puede ser frustrante, especialmente cuando no tenemos ningún indicador para indicar que los datos se están procesando. En este artículo ilustraré una solución conveniente a este problema.

  • En primer lugar, necesitamos crear los objetos que se mostrarán mientras la consulta carga los datos: aconsejaría comenzar creando un rectángulo como capa falsa. Una vez hecho esto, creamos otra imagen que será nuestra animación.

Tenemos muchas animaciones posibles:

View the flash file: Loading Animations in Xcelsius

Así es como aparece la animación:

View the flash file: Xcelsius Animation

  • Luego agrupamos estos dos objetos y los llevamos al frente.

  • En una hoja de cálculo creamos una celda donde vinculamos el estado de la consulta.

  • Llegado a este punto, en propiedades en QaaWs o en la conexión de Live Office seguimos estos pasos:

En la pestaña Uso:

Sección de estado de carga:

  1. En la celda Cargando mensaje, codificamos una "L"
  2. En la celda Mensaje inactivo codificamos una "C"
  3. En la opción Insertar debemos mapear la celda de la hoja de cálculo, en nuestro caso "B1"

  • Finalmente seleccionamos el grupo que habíamos creado previamente, y en la ventana de visibilidad dinámica asignamos el Estado a la celda "B1" y la clave a una "L". Esto significa que mientras se carga la consulta, podemos ver simultáneamente el grupo.

El resultado final es como se muestra a continuación.

Esta estrategia contribuye a proporcionar un entorno amigable para el usuario, en particular en aquellas situaciones de recuperación lenta de datos.

Si tiene alguna pregunta o sugerencia sobre esta solución, no dude en dejar un comentario y con gusto le responderé.

Únete a Clariba y SAP para los eventos Better Business Insight en Doha, abril 18 y en Dubai, abril 20

Dubai, UAE: Clariba and SAP Middle East & North Africa are proud to be hosting two unique events in Doha, abril 18 and in Dubai, abril 20 for C-level executives, IT decision makers, and business managers. The purpose of these sessions is to provide an in-depth look at best-in-class business intelligence solutions in the Middle East and the exciting release of SAP BusinessObjects BI 4.0.

En un mercado global altamente competitivo, marcado por el impulso de las soluciones de movilidad, las empresas se enfrentan continuamente a la necesidad de actuar con decisión en volúmenes crecientes de datos y tomar decisiones rápidas donde sea que se encuentren.

New Class of Analytics: Clariba and SAP offer the first opportunity for business and IT professionals in the Middle East to view the benefits of SAP BusinessObjects BI 4.0, which delivers the most comprehensive suite of BI tools on the market. The 4.0 release of Business Intelligence incorporates the speed of in-memory computing, the mobility of BI on any device and the accessibility of business and social data, allowing for better information management and business insight.

Real Business Results: Clariba has become a recognized and respected Business Intelligence consultancy and SAP partner in the Middle East by working closely with decision makers in finance, sales, marketing, and other functional areas to develop comprehensive analytical solutions across multiple industries. These events also provide attendees with the chance to learn about real business results from influential organizations in the UAE and Qatar.

“As leaders in Business Analytics technology and implementations, Clariba and SAP are ideally positioned to highlight the latest innovations and strategies for better business insight,” explains Marc Haberland, Managing Director of Clariba. “The combination of Clariba’s best practice approach and the power of SAP BI tools provide our customers with a distinct competitive advantage.”

The Better Business Insight with SAP Business Objects BI 4.0 and Clariba event will be held in Doha, abril 18 and in Dubai, abril 20 from 09.00 to 11.00. Business leaders and  IT professionals interested in discovering innovations that are shaping the future of analytics are invited to contact Clariba for more information by emailing events@clariba.com or calling +971 50 100 7441.

Sobre ClaribaClariba delivers innovative, reliable and high-quality business intelligence (BI) solutions to customers worldwide. We are recognized and respected as one of the leading SAP Business Intelligence consultancies in EMEA. Our consultants, based in the Middle East and Europe are SAP BusinessObjects certified professionals and experts in the planning, installation, development and deployment of BI solutions. Clariba develops best practice BI solutions for dashboards, reporting and analysis, providing our customers with clarity and actionable insight to improve their business performance. Our customers in the Middle East are leaders in the telecommunication, education, manufacturing, and banking sectors. By working closely with business leaders and IT teams, Clariba turns vital data from ERP, CRM and other transactional systems into actionable insight for all levels of the organization. For more information on Clariba’s business intelligence solutions visit www.clariba.com

Sobre SAPAs market leader in enterprise application software, SAP (NYSE: SAP) helps companies of all sizes and industries run better. From back office to boardroom, warehouse to storefront, desktop to mobile device – SAP empowers people and organizations to work together more efficiently and use business insight more effectively to stay ahead of the competition. SAP applications and services enable more than 109,000 customers to operate profitably, adapt continuously, and grow sustainably. For more information, visit www.sap.com.

Creación de documentos WebI dinámicos

A menudo nos vemos obligados a encontrar una solución para hacer que nuestros informes de Web Intelligence sean más dinámicos, debido a una necesidad específica del usuario o con el propósito de demos de ventas. En este caso podemos añadir algo de interactividad para hacer nuestras presentaciones más vivas y más visualmente atractivas. En esta publicación encontrará algunos ejemplos para obtener informes WebI más dinámicos que no vienen con el módulo estándar WebI estándar:

  1. Columnas dinámicas
  2. Ocultar y ocultar bloques
  3. Ocultar y mostrar bloques en secciones

Las técnicas explicadas a continuación son válidas no sólo para tablas sino también para gráficos.

1. Columnas dinámicas:

El propósito de esta técnica es cambiar el valor de una columna de dimensión de acuerdo con una selección de su control de entrada. A continuación encontrará las directrices de alto nivel para crear columnas dinámicas:

  • Crear una tabla ficticia en el Universo; Idealmente una tabla derivada con el nombre de las descripciones que desea que el usuario muestre y muestre en el documento. Puede ver un ejemplo a continuación:
Tabla Dummy WebI
Tabla Dummy WebI
  • Estas variables dinámicas deben aparecer en una Consulta separada y estar enlazadas con los datos reales procedentes de una segunda Consulta. Alternativamente, todos los datos podrían provenir de una sola consulta. Si las variables y los datos a presentar no están vinculados, nuestra solución no funcionará.
  • El siguiente paso es crear el control de entrada asegurándose de que el filtro aplicado afecta a todo el informe oa una tabla específica, dependiendo de dónde se encuentren las columnas dinámicas.
  • Once we have all this, we need to build the table or block where our "Dynamic Column" will be located and build a conditional formula with IF and ELSE features. Using our example, if our dynamic variable is called Input control, if the information we want to show is located in the Period table and if the dynamic source fields are Month, Week & Day, then the formula should be the following: =If("inputControl"="Month";[Period.Month];If("inputControl"="Week";[Period.Week];If("inputControl"=”Day”;[Period.Day]))) Make sure the formula sentence is properly defined so that a meaningful result will be displayed when the user applies the "All values" option.

For a more detailed explanation on this topic you can check the Clariba blog article:  How to Use WebIntelligence Input Controls Efficiently from 22 enero 2011 at www.clariba.com/blog.

2. Ocultar / Desbloquear bloques

  • El propósito de esta técnica es ocultar una tabla y mostrar otra con columnas de dimensión cambiando su valor según una selección de su control de entrada:
  • Cree una tabla ficticia (como en el ejemplo anterior) con las opciones que queremos mostrar al usuario y con el propósito de vincular dos consultas (es decir, con la palabra "LINK")
  • Cree una tabla con todos los datos que desea mostrar. Después de eso, es necesario desmarcar una de las propiedades que nuestro bloque / tabla tiene por defecto. Seleccione el bloque adecuado, vaya a propiedades, despliegue la opción "Mostrar" y asegúrese de que la propiedad "show when empty" no esté activa.
  • El siguiente paso es crear el control de entrada, asegurándose de que el filtro aplicado afecta a todo el informe.
  • Luego tenemos que jugar con los filtros de los diferentes bloques. El objeto con la palabra "LINK" necesita ser utilizado como un filtro para cada bloque (igual a). Después de eso aplicamos un filtro con el objeto que usamos antes para el Control de Entrada, asegurándose de que la opción para este filtro sea "no igual a" el valor que corresponde a la tabla real. Tenemos que hacer lo mismo con todas las tablas.

3. Ocultar / mostrar bloques en secciones:

Imagínese que tenemos un informe donde queremos dividir una tabla de tendencias en secciones que muestran las tendencias en "Meses", "Semanas" y "Días". La sección podría ser demasiado larga y el usuario no desea desplazarse hacia abajo para encontrar una determinada.

  • En este caso, haríamos tres tablas diferentes, una para los Meses, una para las Semanas y la última para los Días y colocarlas en la sección, asegurándose de que cambiamos los nombres en la parte superior de la tabla para que los usuarios puedan reconocerlos fácilmente .
  • Seleccione los diferentes bloques y desactive la selección "show when empty" de las propiedades. Cree tres controles de entrada diferentes con todos los valores, uno para cada tendencia posible. Establecer las conexiones entre éstos y su tabla correspondiente.
  • Asegúrese de que el control de entrada tiene un valor por defecto, por lo que sólo una tabla es visible. De esta manera, cuando el usuario hace una selección en un solo control de entrada "tendencia", el bloque correspondiente se mostrará correctamente; Mientras que si el usuario anula la selección de todas las opciones en las tablas de control de entrada, todos los bloques serán visibles.

Las técnicas explicadas anteriormente fueron desarrolladas por nuestro equipo de desarrolladores de Web Intelligence para proporcionar a los usuarios empresariales el valor agregado de la interactividad en sus consultas, análisis y navegaciones.

If you have any questions or feedback about these solutions, please feel free to leave a comment below or send an email to info@clariba.com

Informes de WebI fáciles de mantener

Creating Web Intelligence reports is not the most challenging task for a BusinessObjects consultant, but it can be very time-consuming. Imagine your client asks you to create one document with 50 reports, and he's not sure yet how the reports should look. How can you create all these reports and at the same time make sure that they're easy to update?

Esa es de hecho una pregunta muy importante. Imagine que ya ha creado los informes 50, uno en cada pestaña, y su cliente de repente decide que la etiqueta de los totales no debe ser "Total (1000 EUR)" sino más bien "Miles de euros". Y en lugar de este fondo gris que decidió utilizar de forma predeterminada, al cliente le gustaría tener su azul corporativo.

¿Qué sucederá si no lo pensaste (o leíste este artículo) antes? Terminará cambiando los informes 50 uno por uno. Ok, no debería tomar más de 60 o incluso 30 minutos, pero probablemente tengas un mejor uso de tu tiempo, ¿verdad?

As que echemos un vistazo a algunos consejos:

  • Use variables. The variables are not only quite useful for creating new measures, they're also great as labels. If you had created a variable Label_total (as a dimension) with the value "Total (1000 EUR)" and written in each total name cell "=[Label_total]", then the change would be quite easy. Just edit the variable and there you are! The label is now correct on your 50 reports.

  • Use alerters. Alerters are like "conditional formatting" in Excel. Define a condition, a format, and if the condition is met, then the cell with the alerter will be formatted. This is necessary when you really need formatting to depend on a condition, but it's also a useful tool for easy maintenance. For the condition, choose something always true (for example create a variable always equal to 1, and define the condition in the sub-alerter as "Is this variable equal to 1"). For the formatting, just choose how you want the cell to look (for example with the grey background). Apply this alerter to all cells which should have this background. Now, if you need to change the color, you only need to change the alerter, not all the cells in the 50 reports! Note that unlike in Excel you can also put text in the formatting. So you can actually also use alerters for labels; the downside being that you lose in clarity (you can have something written in the cell's formula and something else displayed because of the alerter).

Esperemos que esta publicación le haya proporcionado algunos consejos para ahorrar tiempo para sus informes WebI que también lo ayudarán a mantenerlos y actualizarlos fácilmente. Si tiene otros consejos de WebI para compartir, ¡no dude en dejar un comentario a continuación!

SAP BusinessObjects: a través de los ojos de los críticos y los clientes

In our day-to-day life we are exposed to many purchasing decisions. Going to the supermarket to get some food or buying widgets in an internet shop is no longer a quick and easy task. The diversification of vendors forces us to go through a conscious or unconscious decision making process. It is always interesting to study the reasoning that leads to an action, especially for marketing people, and it is a social phenomenon in constant evolution, ranging from the traditional word of mouth to the most modern surfing of internet forums.

The same happens when a company has the opportunity to make a BI investment and has to choose a vendor that fulfills their particular needs. There are some specialized consulting companies that carry out complex market studies, but the feedback received from clients or contacts is just as influential to the decision making process.

This blog article is focused on the latest studies from Gartner and Forrester regarding SAP BusinessObjects.

The Forrester Wave: Enterprise Business Intelligence Platforms, released during the last quarter of 2010, considers SAP BusinessObjects to be leading the market together with IBM Cognos, Oracle and Information Builders, followed by SAS, Microsoft and MicroStrategy close behind. The 145 criteria used correspond to vendor surveys, product demos and customer reference surveys.  The end result is a graph that situates BI vendors in relation to their current offering and strategy.

SAP BusinessObjects is recognized as having very good BI tools for each job:

  • Crystal Reports as top report writer embedded in thousands of applications;

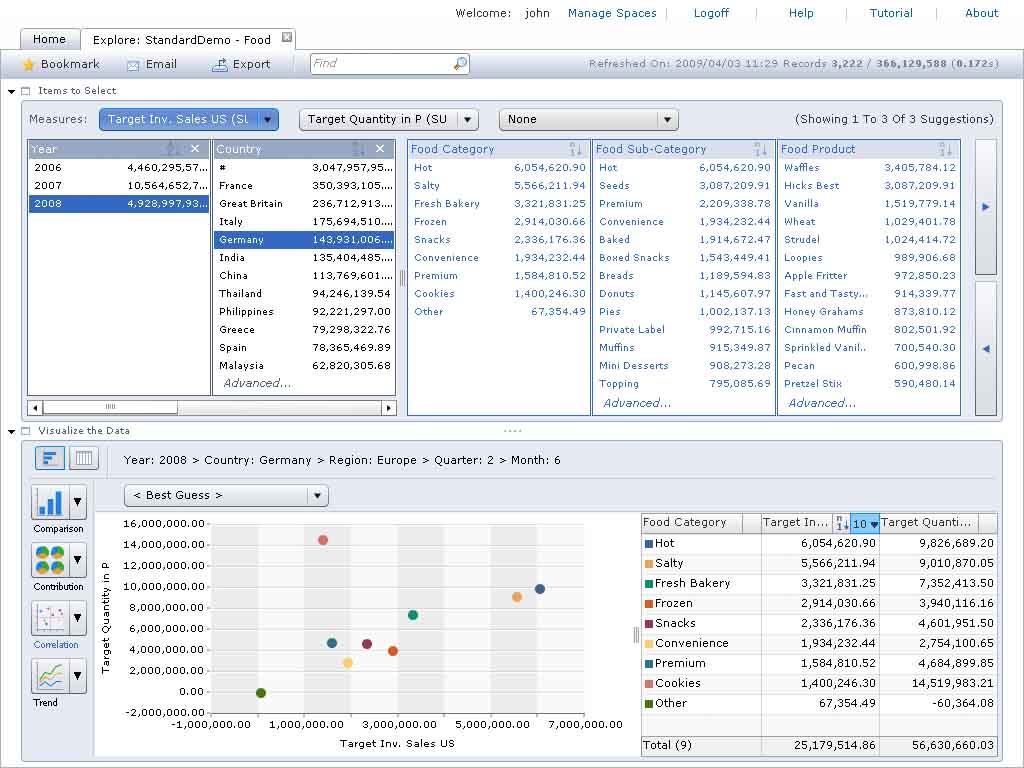
  • Explorer as a combination of the power of OLAP and the simplicity of search, exploration and analysis;

  • SAP BusinessObjects Dashboards is very popular amongst executives that can visualize the generated flash in disconnected mode and no SAP software installed;

  • BEx being still the most widely used and popular query and analysis tool for SAP BW users;

  • Business Warehouse Accelerator with the speed of in-memory database to provide a powerful DBMS optimized for BI;

  • SAP is also leading in self-service BI software as a service (SaaS) offerings.

According to Forrester, the downside of having all these tools is a poor product integration and a lack of object reuse from product to product, which is supposed to be improved with the new release BI 4.0 in Q1 2011.

Gartner’s Magic Quadrant for Business Intelligence Platforms, released in enero 2011, considers the same leader vendors as Forrester and also adds QlikTech thanks to its recent continued growth. It uses standard criteria divided into two categories: completeness of vision and ability to execute. According to the study, a good strength is to have the largest share of the BI platform market (combination of SAP NetWeaver BW and SAP BusinessObjects) with an installed base over 46,000 customers and one of the largest channel and services ecosystems. Reporting and ad-hoc querying capabilities were rated high by customers, whereas other SAP NetWeaver BW tools were below the market average. However, in regards to OLAP, BEx Analyzer seems to be more widely used than Voyager. The complements to the BI platform are also seen as positive: collaboration and decision support (StreamWork), Text Analysis, search-based data exploration with its Explorer product, and the enterprise information management products with data integration, lineage & impact analysis, and data quality. The vision for an in-memory appliance, HANA, promises to solve many of the perennial performance issues of large complex BI deployments in general (given its SQL and MDX access for third-party BI tools) and SAP BW in particular. As also reported by Forrester, SAP has been one of the first of the leading BI vendors to introduce a SaaS offering, BusinessObjects OnDemand BI. In addition, SAP has also made investments in mobile BI with its Sybase acquisition and the SAP BusinessObjects Explorer iPhone/iPad application.

In the cautions part of the report, Gartner mentions some concerns that customers have about the roadmap after product changes to support optimizations with the SAP Business Applications and NetWeaver BW products, and also a perceived higher cost of ownership. Migration, implementation and integration choices are reported to be confusing by some customers. Finally, ratings for support, software quality and sales experience are unfortunately low compared to other vendors in the survey. This is currently being address by SAP; they are giving more and more importance to Channel Partners like Clariba, which can provide high quality uninterrupted support, much more aligned to the customer needs.

If you have any questions or comments about the Gartner or Forrester summaries mentioned in this article, or would like more information about Clariba’s SAP BusinessObjects services, please leave a comment below or contact us at info@clariba.com.

Instalación de Business Objects en Linux - Parte 1: Preparación del sistema

At Clariba we have seen a clear dominance of Windows operating systems during our Business Objects implementations. But what happens when we face the challenge of a Business Objects implementation on a Unix-like system? What are the main differences? How does the consultant need to prepare? What are the pre-requisites? What are the risks and possible ways to overcome them?

We were recently challenged with these questions and we wanted to keep track of this experience and share it with everyone. So I will share below some tips for implementing Business Objects on a Unix-like architecture, more specifically: Linux.

The intention of the first part of this article will be to focus on how to prepare your Linux distribution so the installation runs smoothly. I will follow up with a future article to go into additional details about the Linux setup.

Step 1 – Defining your environment

In any implementation, prior to execution, it is vital to define the scenario you will be facing. This is even more important when implementing on a Linux system. The most important fact you need to know is what type of Linux you will be using and if it is supported by Business Objects.

Officially the Linux distributions supported by Business Objects are Red Hat and SUSE (although other distributions like CentOS have also been proven to work due to similarities with Red Hat).

Linux Operating Systems

It is a must to go through the supported documents pdf for Linux available at the SAP Marketplace. In this document you will find specific details on the versions and patch level that you need to comply with in order to install Business Objects.

BOE XI 3.1
BOE XI 3.1

Paso 2 - Preparando la caja de Linux

Root Access and Installation User First of all you need to have root access to the system. Although this is not required for the setup, along the way there will be modifications that need to be made to the system that require root privileges.

Also make sure there is at least one additional user in the system. This user will be the executor of the Business Objects setup. Most current Linux distributions already create an additional user at setup.

Red hat enterprise linux 5

Install Files Download the installation files for Linux and save them on a folder that references the installation sources (i.e. /boinstall). Also create a new folder where the BO system will reside (i.e. /bobj)

Installing files in Linux

Modifying Your System Now it is time to get our hands dirty. The following modifications need to be made to your Linux system in order for the Business Objects installation to run smoothly. It is advisable to have a minimum level of knowledge around Linux administration and terminal console commands to facilitate the editing of some of the files mentioned below.

1) Modifying Locale variables The first thing you will need to do is to update a couple of locale variables. Navigate and open the file: /etc/sysconfig/il8n You need to add the following two lines to it:

LANG = en_US.utf8 export LC_ALL = en_US.utf8

What we are doing is correcting a small spelling mismatch on the US utf8 standard value. The above instructions on the file will ensure that those variables are correctly set at boot time. However they can also be run separately on a terminal console at any time.

To make sure your variables are correctly set you can type “locale” on your terminal console. A listing with your available locale variables should pop up.

Modificación de variables locales en Linux

2) Permissions to Source and Install folders You will need to set execution and write permissions to the folders created previously for the source install files and the folder where the Business Objects system will reside. To do that you need to run the following commands on the console as root:

chmod -R 755 /boinstall /bobj chown -R usergroup:user /bobj /boinstall

Note that I’m using the folder names suggested earlier for the folders; usergroup:user is the default non-root user that would be running the installation and a default group it belongs to.

Be very careful with the spelling of these lines. Chmod is a powerful Linux command that could render your system unusable if not used wisely.

3) Setting up Hosts file Go to /etc/hosts as root and open this file for edition. You will need to add a line to resolve your Linux system IP through the network. It should look similar to the following:

192.168.0.1    linuxsystem

Ya debe haber una línea para 127.0. 0.1 que es la definición de la interfaz de red localhost o loopback. Guarde el archivo hosts con la nueva línea para su sistema.

Para probar que la línea de los archivos hosts se ha configurado correctamente, intente ejecutar un comando ping desde la consola al nombre de su sistema:

ping linuxsystem

Debe recibir una respuesta si el archivo hosts se ha establecido correctamente.

Ping sistema Linux
Ping sistema Linux

4) Disable SE Linux Still logged in as root, modify the SE Linux functionality. There are three levels for it:

  • Aplicación: el modo predeterminado que habilitará y aplicará la política de seguridad de SELinux en el sistema, denegando el acceso y las acciones de registro
  • Permissive: In Permissive mode, SELinux is enabled but will not enforce the security policy, only warn and log actions. Permissive mode is useful for troubleshooting SELinux issues
  • Disabled: SELinux is turned off
Configuración de nivel de seguridad

Deberá cambiarlo a Permisivo o Desactivado.

5) Adding libstdc++ libraries In some cases (CentOS) these libraries are not available by default. You can try to add them from the Linux repositories running the following command:

sudo yum install compat-libstdc++-33

This library can also be found on different places and formats on the web. If not installed, Business Objects setup will fail, indicating the missing library.

En resumen...

if you have completed the steps above, you are now ready to install Business Objects on your Linux box.

We will be covering the Linux setup in the second part of this article. Stay tuned for Part 2 coming soon and please feel free to leave questions or feedback below using our Comments form.

It is a must to go through the supported documents pdf for Linux available at the SAP Marketplace. In this document you will find specific details on the versions and patch level that you need to comply with in order to install Business Objects.

It is a must to go through the supported documents pdf for Linux available at the SAP Marketplace. In this document you will find specific details on the versions and patch level that you need to comply with in order to install Business Objects.

EspañolEnglish