""

SAP BusinessObjects

SAP Universe Designer Tricks and Tips: Table Mapping

You know everything there possibly is to know about SAP Universe Designer right? Well, I bet that there´s still a trick or two you can discover. For example, there is one function not frequently used in Universe Designer called Table Mapping. This option was originally included in Universe Designer to protect some data to be seen by Developers (the developers´ user group sees the data from a different table than the Business users).

In this article we are going to show how to implement this table mapping feature for the use that it was meant for and we will then apply it in a couple of real life scenarios to provide developers with a simple and effective solution that minimizes the maintenance on their systems.

In order to create a replacement rule, follow the steps below

1. Go to Tools – Manage Security – Manage Access Restriction.

Foto 1
Foto 1

2. Click New to create the new restriction

Picture2
Picture2

3. Go to Table Mapping and click Add to create the new rule

Picture3
Picture3

4. Fill in the tables you want to replace. In this case, we want the developers to see the data from the table SALES_FACT of the schema DEV_DB instead of PROD_DB (where we are storing the production data).

Imagen4
Imagen4

5. Click ok, fill in the name for the rule (In this case Developers Sales) and click ok

Picture5
Picture5

6. To apply this rule only to the user group “Developers”, click on “Add user and group”

Picture6
Picture6

7. Select the group IT, and click Ok

Picture7
Picture7

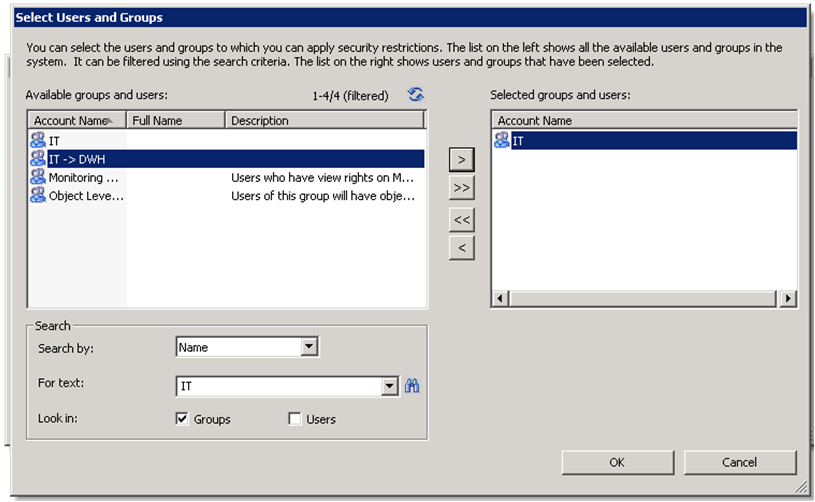
8. Apply the rule to the IT group

Picture8
Picture8

Once we have published the universe, all the reports will change the SQL code automatically between the tables DEV_DB.SALES_FACT and PROD_DB.SALES_FACT depending on the user that is logged into the system.

One important point to take into consideration is the priority of the rules: In case of conflict, the restriction with the highest priority – lowest priority index –  lowest priority number will apply.

The example we reviewed above (dynamic change between developers and business user tables) is the most typical use for this functionality. However, there are some other scenarios where the table replacement could be very useful:

Scenario 1: We are reloading data on a production table. Previously, we have created a copy of the old data in a temporary table that we want to use for reporting while the reloading has not finished.

Solution: We can add a new rule to replace the original table for the temporary one, and apply it to the group “Everyone”. As soon as the reload is completed we can delete the rule. This process is much faster than renaming the table on the universe and to change all the objects that the universe is using on this table.

Scenario 2: We have different fact tables for different departments with the same or similar table structure and  all the dimension tables are common. We are looking for the best solution that reduces future maintenance.

Solution: Instead of creating different copies of the same universe by changing the fact table, we can create one universe and use the table replacement functionality to dynamically switch the fact table depending on the user functional group (in this case would be the department) that the user belongs to.

As we have seen in these examples this table mapping feature provides the developers with simplicity, effectiveness and maintenance reduction on their systems.

Si tiene alguna pregunta, no dude en dejar un comentario a continuación.

Xcelsius in BI on Demand (BIOD)

In this blog article I am going to talk about Xcelsius in SAP BI On Demand (BIOD). What I am going to explain are the steps that you should follow to upload an existing Xcelsius Dashboard to the BIOD system. 

What is BIOD?

First of all, for those who don’t know what is BIOD I will give a brief explanation. Basically we can say that BIOD is the most complete and approachable cloud based business intelligence suite available in the market today. BIOD is software as a service; you do not need to install any software on your machines to get instant value from the system. All you need to do is Log in and provide some data. It is a cheap BI solution, due to the fact that you don’t need to make a huge investment in hardware, licenses, etc... everything is in the net.  The target for this technology is small companies, which are less likely to be able to acquire a BI system due to the costs, but with BIOD they have an accesible  way into SAP BusinessObjects analysis system. In BIOD you are able to create:

  • Xcelisus Dashboards
  • Web Intelligente reports
  • Explorador

You can get more information about BI On Demand here.

 Now, let´s see how to upload an existing XCelsius Dashboard to the BIOD system.

How to upload an Xcelsius Dashboard to BIOD?

First of all, if you don’t have a BIOD account you should create it. It s free, and with it you will able to test most of the features of this cloud system. Click here to Sign up.

Once we are logged, we will see this screen.

Now I want to show you how you should upload an existing Xcelsius file with static data to the BIOD system.

First of all we should create the DataSource, so in my Stuff panel we should select Datasets. After that we click Add New Button  -> Add Dataset

Then we should chose from which place we will select the dataset. We have several options: Create From Query (this option is only available in the BIOD Advanced version, where the connection to a universe is possible), bring data from salesforce or create an empty dataset from scratch and finally, we can upload a file (xls,xlsx or csv) which we will use in this example.

As I said before, we select an excel file as source of our dataset, in the first row of our excel file it is important to have the labels of each column. We can also edit this dataset, change the value type of each column, the label name, etc...

At the bottom of this page we can find the properties section, here we should enable the Web service. Once we have done this, the system will generate a url that will be the reference to the dataset in our dashboard.

The next step will be to upload the Xcelsius file as a template, so we select Add New -> Add Template.

We create a name for this template, uncheck the Create a new Xcelsius file check box and finally, select the xlf file that we have locally.

The screen below will then appear. In order to connect the dataset to our xlf file we should select the blue sentence (you may click here to edit the Xcelsius file). You can also attach an image of the dashboard as a thumbail for repository. The object selection will be fancier.

Once the Xcelsius editor is opened we add a connection using OnDemand -> Add Connection menu option. This will create one Flash Variables connection ([Flashvar]) and two Web Service Connections ([OD_Data1 and OD_Data2). In our case we should delete one data connection because we only have one source, but in case we need more data sources we can create as many as we want. It will also create a new tab in the XC spreadsheet that contains these cell bindings.

After that we configure the data connections. Open the Data Manager (Data -> Connections) and you will see a Connection of type FlashVars.  You should see the following:

  • get_data_url: (mandatory). This should be bound to the cell which the Web Service Url of the Web Service Connections are also bound to. If you have multiple connections this should be bound to the range which holds those connections.

Then each Web Service Connection (OD_DataN), in our case only OD_Data1 points to the set of cells to which that connection outputs its data.

These are the next steps that you should follow in order to setup the dashboard:

  • Click on My Datasets and click copy beside the dataset OD_Data1.
  • Paste the url from dataset to the WSDL URL input box of a Web Service connection

  • Click Import to import the schema.
  • Bind the web service url to the same cell as get data url (Note: if you used the Add Connection process this should already be done).
  • Bind the headers and the row values.
  • Set Refresh on Load to be true.

After these steps you can save your changes and then click the Back button to go back to Edit Connection step of creating a template. You should see your connection listed on the screen.

Click Next to go to the Edit Sample Data step, you can choose to add in your sample data from the XLF if you like, and then click Finish.

Finally we will create a visualization using this template. We select our Data Input, in this case Data Source.


If we go to the visualization menu we can find the object.


In conclusion we can say that the BIOD system is a nice tool to start testing the power of the SAP solutions without a potential heavy investment at the beginning. It can be also a good tool to make demos on and show our dashboards to customers. It is very interesting to test the explorer tool, you can see the amount of options that the BIOD brings you in terms of data analysis.  If you are interested in the advanced solution you should get in touch with SAP.

If you have any comment or doubts do not hesitate to contact us or leave a comment below.

Abordar el dilema de la conciencia agregada

In my last project I faced a situation where the customer asked me about the best option for a particular topic and this time my answer had to be "it depends". As a consultant, my duty was to provide two different options (with their corresponding pros and cons) but I could not make a decision on this, since the answer was highly dependent on the composition of IT service providers in different areas and also their road map. In general BI terms, we could define aggregation as the process of summarizing information at a certain level of detail in order to improve the performance. The Kimball Group defines Aggregate Navigation as the ability to use the right aggregated information and recommends to design an architecture with services that hide this complexity from the end user. In the BusinessObjects world the same concept is called Aggregate Awareness and the database administrators community usually refers to it as query re-write.

En SAP BusinessObjects, esto se puede lograr mediante el uso de la función @aggregate_aware, contextos y objetos incompatibles en el diseñador de universo. En un nivel de base de datos (RDBMS), ciertos proveedores proporcionan esta característica a través de vistas materializadas con opción de reescritura de consulta (Oracle, Sybase, DB2, Informix, PostgreSQL y algunos otros).

Así que aquí tenemos el dilema: ¿dónde colocar esta lógica en un entorno de cliente: en la capa física o en la capa lógica?

Ambas opciones son válidas, pero hay algunas consideraciones que deben tenerse en cuenta desde diferentes puntos de vista:

Comparación de tablas

La información que se ve en la tabla anterior ya puede ser interpretada, pero como resumen, mi recomendación sería:

Implementación de la conciencia agregada en SAP Business Objects:

  • Ideal para una arquitectura con muchas fuentes de base de datos (no todas las fuentes de base de datos admiten la característica de reescritura de la consulta y debe mantenerse en cada una de ellas)
  • Es bueno tener si el proveedor de la base de datos puede ser cambiado en el futuro (no hay cambios necesarios en el universo)
  • No hay acceso a administradores de base de datos que puedan ajustar correctamente la base de datos
  • Arquitectura de informes cerrada basada en una capa semántica fuerte en Business Objects
  • Existe la necesidad de un repositorio centralizado de metadatos

Implementación de mecanismos de reescritura de consultas en el RDBMS:

  • Ideal para una arquitectura con muchas herramientas de informes que acceden a la misma base de datos
  • Acceso a administradores de bases de datos sólidos
  • Simplifica el diseño del universo
  • No es necesario un repositorio centralizado de datos

If after reading this post you still have doubts on what direction to go for at your company or customer, do not hesitate to contact clariba at info@clariba.com or leave a comment below.

SAP BusinessObjects Explorer 3.2: Creating Row-Level Security

In the past few months I had the chance to implement a solution based on the combination of SAP BusinessObjects Explorer and mobile devices. The challenge was: “I want to explore the same information that I see on my dashboards with SAP BusinessObjects Explorer on my iPad. In this particular case, some of the customer`s dashboards were really complex and we had to deal with many issues. Today I would like to share with you how we solved one of these issues:

How to implement row-level security into a space of Explorer?

The solution to this challenge cannot be based in any case of security implemented at universe level, in SAP BO Explorer the information of the spaces is retrieved when we index the space, this means that any kind of security applied at universe level will have a direct impact when we index the space. What we needed was a space with all the information but able to be filtered on demand based in some personalization rules.

With SAP BO Explorer 3.2 we are able to generate and apply this kind of security by creating two spaces: one reference space with all the possible information to explore and one personalized, where we will be able to filter the information displayed on demand based on the rules of personalization and making use of the reference space.

Definition of the scenario

To be able to follow the implementation of the solution, assume that we start from:

  • SAP BusinessObjects XI 3.1 installed and fully operational
  • SAP BusinessObjects Explorer 3.2 installed and fully operational

To make it easy to follow I will make use of the eFashion universe and we will need to create users in BO according with the list of values of Name of Manager dimension (Store -> Store Details->Name of manager).Note that the name of the users should be exactly the same as the values of the dimension.

We will create a new space based on the eFashion universe information. The personalization rule is that the Store managers will have access to the space but they will only be able to see the information related to their Store(s).

Creating the e-Fashion Reference space

First open SAP BO Explorer and login with administrator credentials. Click in Manage Spaces, select e-Fashion Universe and press New

In the tab Properties introduce a Name, in our case eFashion Ref, and select a folder under Public Folders, for the example Public Folders -> Explorer Spaces

The users should not be able to access this space, so remember to uncheck the option Show on Home Page

In the tab Objects select the objects that we will use in the space, in the example this tab will look like this

Then click Validate the space and then OK to save the space

Now you will have to Index the space, to do this just press the Index buttonOnce the status check shows the following symbol the space is successfully indexed.

Creating e-Fashion Personalized Space

Now we will implement the space to be accessed by the users, in this space we will make use of the eFashion Reference space created before to build a space with the personalization rules defined.

Log in with Administration rights into SAP BO Explorer, go to Manage Spaces, select the eFashion universe and press New. In the tab Properties introduce a Name, in our case eFashion Pers, and select a folder under Public Folder, for the example Public Folder -> Explorer Spaces

Select the same objects that we have used to create the eFashion Ref espacio

Go to tab Personalization, check Personalize information space Exploration and Select the eFashion Ref space from the list Select an information space

Now select Usuario, from the table To Filter, and select Name of the Manager in the drop-down list in the column Filtered By.

We will link the rest of the dimensions of the personalized space with their corresponding ones on the reference space. The Personalization tab should finally look like this:

Validate the space and press Ok to save it and Index the new space eFashion Pers

Security Topics

Before testing the solution, and to avoid strange behaviors of the SAP BO Explorer spaces, we will have to review the security applied to the different components involved in SAP BusinessObjects. To “make our lives easier” I suggest creating a User Group (i.e. Explorer Users) in SAP BO and I strongly recommend reviewing this list of topics to ensure that the group has:

  • Granted access to Explorer application
  • Granted access to the Universe
  • Granted access to the Connection used on the universe
  • Granted access to the folder where the spaces will be stored.

In this example, what I did was to grant View On Demand access to all of the items of the list.

Finally the solution is ready to test!

Testing the solution

Log on in SAP BO Explorer with one of the users we have created, i.e. Quinn, from the Home tab we will access the eFashion Pers space and see only the data belonging to manager Quinn

If you log on with another user created, i.e. Steve, from the Home tab we will access the eFashion Pers space and see only the data that belongs to Steve

I hope you found this article interesting. For any queries regarding the contents of this article please leave a comment and I will readily reply.

SAP BusinessObjects Mobility Solutions (Parte 1 - SAP Explorer)

Como ya habrás notado, vivimos en un mundo móvil. El uso creciente de dispositivos móviles para las tareas cotidianas se ha convertido en un lugar común en el transcurso de la última década. La inteligencia de negocios no se ha quedado atrás en esta tendencia. En esta serie de dos publicaciones de blog sobre soluciones de movilidad de SAP Business Objects, analizaremos las aplicaciones móviles que SAP Business Objects ha puesto a disposición para llevar BI a dispositivos móviles (más concretamente al Ipad): SAP Explorer y SAP BI Mobile.

A través de este análisis aprenderemos cuál es el proceso para instalar las aplicaciones y revisar algunas cosas importantes que debemos considerar. Nos centraremos sólo en su pieza de movilidad (Explorer, por ejemplo, también se puede acceder a dispositivos no móviles) y también revisaremos algunos detalles de la instalación del lado del servidor para cada herramienta.

Both of these tools can be downloaded through SAP Marketplace (if you are an SAP partner).

Si usted no es un socio de SAP pero siente como probar estas herramientas, puede descargar las aplicaciones móviles de la tienda de aplicaciones y probar los servidores de demostración que SAP ha puesto a disposición.

En primer lugar, vamos a darle algunos detalles sobre nuestro entorno de prueba y el software que se instaló en él.

Software:

Business Objects XI 3.1 SP3 Enterprise

  • Sql server 2005

  • Explorador SAP 3.2

  • BI Mobile 3.1 SP4

Hardware (Máquina Virtual):

  • Servidor de ventanas 2003

  • 4 GB RAM

  • 2 procesadores

  • Disco duro de 30 GB

Con la configuración anterior dispuesta vamos a empezar con nuestra primera herramienta móvil de SAP Business Objects.

Explorador SAP

Esta es la primera herramienta de SAP basada en la tecnología en memoria. Está dirigido a usuarios ocasionales que requieren un marco de trabajo ágil y preconstruido para la generación de informes pero que todavía les permite filtrar y buscar datos intuitivamente. Se lanzó inicialmente como una aplicación web sólo, pero las características mencionadas lo convierten en un candidato obvio para dispositivos móviles, por lo que la aplicación móvil salió poco después.

Una vez que haya descargado los archivos del instalador de SAP Marketplace, es hora de instalarlo en nuestro entorno de Business Objects.

Instalación

La instalación de SAP Explorer es bastante sencilla. Usted encontrará que hay muy pocas pantallas que tenemos que prestar mucha atención y estos son los que se centrará en este post.

Debería instalar la aplicación y los componentes del servidor web juntos o separados, dependiendo de la configuración del sistema. En nuestro ejemplo instalaremos todo el producto en una sola máquina.

Para los entornos en los que el servidor web no se encuentra en la misma máquina, tendrá que instalar independientemente el componente de servidor de aplicaciones web en la lista anterior. Sin embargo, también es posible instalar, por ejemplo, el servidor de indexación en una máquina separada para optimizar la eficiencia. El servidor de índices es el encargado de generar el espacio y puede requerir una gran carga de procesamiento dependiendo de su configuración.

Las credenciales del administrador serán necesarias durante la instalación, así que asegúrese de tenerlas a mano, así como el nombre y el puerto del CMS.

Finalmente se pedirá el nombre del nodo. Esto se utiliza para identificar la instalación en la configuración del explorador múltiple / paralelo. Por ejemplo, para vincular un servidor de indexación aislado a su servidor maestro. En nuestro caso dejaremos el nombre del nodo con el nombre por defecto (que en este caso es el nombre del equipo) ya que toda nuestra instalación reside en el mismo lugar.

Once the installation is complete we can test it by accessing the following url: http://yourserver:8080/polestar

Si todo está configurado correctamente verá la pantalla de inicio de sesión para el Explorador.

NOTE: If you would like to review the installation process in more detail it is best to review the Installation Guide also available in the SAP Marketplace.

Creación y configuración de un espacio

El siguiente paso es crear un espacio. El espacio es el dato indexado que el Explorador construye basado en un Universo o Archivo. Para construirlo, tendremos que hacer lo siguiente:

  • Iniciar sesión en SAP explorer

  • Haga clic en la opción Administrar espacios

  • Seleccione un universo

  • Seleccione Nuevo

Proporcionar la información necesaria para construir el espacio. Necesitaremos proporcionar al menos:

  • Nombre del espacio

  • Ubicación de almacenamiento

  • Las dimensiones y hechos que se computarán en el espacio

Una vez que el espacio se ha configurado ahora necesitamos indexarlo. Este proceso se puede ejecutar bajo demanda o se puede programar, como un evento único o recurrente. Dependiendo del tamaño de los datos seleccionados de su universo, este proceso puede tardar de minutos a horas, así que tenga en cuenta esto antes de que las consultas de ejecución larga estén configuradas para crear un espacio. Una vez que el espacio haya terminado de indexar sus datos, se marcará con un cheque verde.

Ahora podemos conectar nuestro dispositivo móvil al espacio!

La aplicación móvil

Antes de conectar tu dispositivo, primero debemos descargar la aplicación desde la tienda de aplicaciones. Lo encontraremos bajo el nombre "SAP Explorer".

Una vez descargado necesitamos configurar una nueva conexión con los siguientes detalles:

  • Nombre de la conexión

  • Nombre del sistema CMS

  • Nombre de usuario (con permisos para utilizar Explorer)

  • Contraseña

  • Tipo de autenticación

No hay requisitos complejos en esta pantalla de configuración. Sólo asegúrese de proporcionar los datos correctos para cada componente (servidor web, cms, cms puerto, etc).

NOTE: the official SAP Explorer Mobile installation guide specifies that installing SAP BI Mobile servers is a requirement. In reality, this is only optional and by installing SAP Explorer server you should be able to access Explorer with your mobile device.

Ahora debe ser capaz de iniciar la conexión con el servidor Explorer y trabajar con el espacio creado antes. En este ejemplo usaremos la conexión de Experiencia de SAP que viene configurada por defecto en la aplicación de Ipad.

Si la conexión es correcta, debe encontrar la siguiente pantalla con todos los espacios disponibles:

Una vez que un espacio se selecciona de la lista que se enfrentan a una pantalla que se parece bastante similar a lo que has visto en la versión web de Explorer.

La versión móvil de SAP Explorer no tiene diferencias en las funcionalidades en contra es la versión basada en Web y sólo se han realizado cambios menores para adaptarse a la interacción táctil en el Ipad.

Como usted ha visto, instalar y preparar SAP Explorer Mobile es una obviedad. Ejecute el proceso de instalación y está configurado para comenzar a utilizar espacios y análisis en memoria en el Ipad.

A partir de ahora no hay otras aplicaciones lanzadas por SAP para otras plataformas móviles (es decir, Android). Algunos podrían decir que esto no es necesario debido a otras plataformas de apoyo de la tecnología flash, pero la capacidad de respuesta de la aplicación de Ipad definitivamente establece esta versión appart. Esperamos ver pronto aplicaciones dedicadas a otros dispositivos móviles.

La próxima aplicación móvil - SAP BI Mobile - se tratará en el siguiente artículo de la serie, que debería estar a principios de enero.

Si está interesado o ha trabajado con esta aplicación, o si cree que podría ser útil en su organización, por favor deje un comentario a continuación.

StreamWork - el entorno de trabajo colaborativo de SAP

Estamos notando que nuestros clientes y clientes potenciales están empezando a buscar modelos y flujos de trabajo colaborativos. La razón es que quieren fomentar y mejorar el trabajo en equipo y reducir los errores humanos mediante la creación de flujos de aprobación para sus tareas internas. Por lo tanto, si ayer los usuarios de poder o TI podría modificar directamente los valores de una base de datos sin ningún control, hoy en día, con un número creciente de empleados y un creciente nivel de complejidad para los procesos, prefieren los flujos de trabajo formales para impulsar la eficiencia y siempre garantizar la aprobación De la gestión, un modelo colaborativo que puede reducir o incluso eliminar los errores provenientes de la falta de control sobre las acciones.

SAP aún no tiene ningún motor de flujo de trabajo (o al menos no lo tenemos en cuenta), pero tenemos lo que SAP llama "Social Intelligence" herramienta, que se llama StreamWork.

Esta solución parece una mezcla entre Facebook, Twitter, LinkedIn y MS Outlook / Proyectos. He tomado algunas imágenes de la pantalla de impresión durante las pruebas que he hecho en uno de nuestros clientes, para que pueda ver lo que está disponible:


Los usuarios pueden crear tareas / actividades y agregar participantes;


Añade acciones a diferentes tareas;


Administrar alimentos y controlar lo que están siguiendo;


Establecer agendas y matrices RACI;


Definir configuración de notificaciones y obtener recordatorios de correo electrónico en su bandeja de entrada ...


... en pocas palabras: pueden colaborar mientras trabajan en un proyecto.

If you want to access a free version of StreamWork, please go to www.streamwork.com and sign in. Moreover, you can find a white paper attached sap_streamwork, where you can read what SAP says about it. In my opinion, a very interesting tool, worth checking it out.

Cómo buscar de forma más rápida y eficiente con Firefox (y Chrome / Opera)

Implementing technologies in environments that are always changing often generates doubts and challenges for us consultants. Of course you can ask your colleagues, but they are not always free and sometimes they just don't know the answer.  So most of the time we are relying on the Internet to find tutorials or people who met the same problems before and explain how they have solved them. Therefore being able to search fast and efficiently makes our lives easier. Fortunately, some of the modern browsers (who said IE6?) give us this possibility. I will now give three main tips to improve the way you search the internet - if you don't have much time, jump directly to the 3rd tip, which is the most effective one.

Este artículo se centra en Firefox, pero también se mencionan navegadores alternativos.

Tip n°1: add search engines to your browser (Firefox, Internet Explorer, Chrome, Opera and Safari).

En Firefox puedes ver la casilla del motor de búsqueda en la esquina superior derecha de tu ventana.

If you click on the symbol on the left (here the Google icon), you will see a list of all the search engines you have already installed, plus an option to manage search engines. One of the best options available to look for new search engines (at least for Firefox, IE and Chrome) is the Mycroft project: http://mycroft.mozdev.org/

Por ejemplo, si buscamos cuáles son los motores de búsqueda correspondientes a SAP, encontramos (unter section 6. Computer) lo siguiente:

Simplemente haga clic en uno de ellos y confirme que desea utilizarlo como un nuevo motor de búsqueda.

Ahora puede realizar búsquedas basadas en este motor de búsqueda.

Tip n°2: assign keywords to your search engines (Firefox, Chrome and Opera).

Asignar palabras clave a sus motores de búsqueda es bastante fácil. Abra la ventana "Administrar lista de motores de búsqueda", seleccione el motor de búsqueda de su elección, haga clic en "Editar palabra clave ..." y simplemente escriba una palabra clave - y es mejor que lo haga corto, por ejemplo "g" para Google Y "w" para Wikipedia.

Una vez que haya hecho esto, no es necesario seleccionar manualmente el motor de búsqueda más! Vaya a la barra de direcciones (recuerde el atajo Ctrl + L), y simplemente escriba la palabra clave para el motor de búsqueda elegido, seguido por el término buscado. Ejemplo: "g rápido mart" si desea buscar marts rápido en Google, o "w SAP" si desea ver la página SAP Wikipedia.

Tip n°3: use bookmarks with the %s variable (Firefox, Chrome and Opera)

La característica de los motores de búsqueda tiene muchas ventajas, pero también algunas limitaciones claras.

The most obvious is that not every website has an associated search engine, like for example the very useful Business Objects Board.

La segunda limitación se debe a la naturaleza de los motores de búsqueda - que son bastante específicos del navegador, y el proceso de respaldo de ellos / restaurar no siempre es sencillo.

Afortunadamente, hay una solución aún mejor que combina todas las ventajas de los motores de búsqueda con la flexibilidad de los marcadores. La solución consiste simplemente en usar "% s" en la URL de un marcador.

Tomemos un ejemplo sencillo: a menudo se utiliza el excelente WordReference.com para traducir del inglés al italiano y al revés. Si abre el sitio web, escriba la palabra "printer", elija "English-Italian" y presione Enter, obtendrá en la página "http://www.wordreference.com/enit/printer". Ahora cree un nuevo marcador, pero reemplace la" impresora "en la URL por" S ". Usted termina teniendo una nueva URL" http://www.wordreference.com/enit/%s". Asigne una palabra clave a este marcador, por ejemplo en_it. Ahora si escribe "en_it impresora" en su barra de direcciones (una vez más recuerde Ctrl + L), que se toman a la misma página.

La gran ventaja de los marcadores es que se pueden sincronizar con bastante facilidad, ya sea con Firefox Sync o Xmarks.

Aquí hay una lista de algunos de los marcadores que utilizo casi todos los días, con URL y posible palabra clave. ¡No dudes en usarlos!

  • Acrónimo Finder (acro) http://www.acronymfinder.com/~/search/af.aspx?pid=osearch&string=exact&acronym=%s

  • Consejo de los objetos de negocio (bob) http://www.google.com/search?name=f&hl=en&q=site%3Ahttp%3A%2F%2Fforumtopics.com%2Fbusobj%2F%20%s

  • Cambridge Britsh English Diccionario (dicoen) http://dictionary.cambridge.org/search/british/?q=%s

  • Imágenes de Google (img) http://www.google.com/search?hl=en&q=%s&um=1&ie=UTF-8&tbm=isch&source=og&sa=N&tab=wi

  • Google Maps (mapas) http://maps.google.com/maps?q=%s

  • Google nosotros (ge) http://www.google.com/search?name=f&hl=en&q=%s

  • Google france (gf) http://www.google.fr/search?q=%s

  • Wikipedia English (us) http://en.wikipedia.org/?search=%s

  • Wikipedia Francés (wf) http://fr.wikipedia.org/?search=%s

  • Notas de SAP (sapnote) https://service.sap.com/sap/support/notes/%s?nlang=E

Si tienes más consejos, o si sientes que falta un marcador útil de mi lista, compártela con nosotros en un comentario a continuación.

SAP Strategy Management: Cuando la personalización genera nuevos estándares

Durante el tiempo que pasamos en nuestro cliente en Abu Dhabi, aprendimos mucho sobre la personalización SSM hasta que nos dimos cuenta de que el producto final podría ser un nuevo estándar en lugar de una personalización. Nuestro cliente tenía algunas preocupaciones sobre las características del out-of-the-box y nos pedían que modificáramos la funcionalidad añadiendo nuevas y automatizando toda la plataforma.

El mayor reto que tuvimos fue relacionado con el flujo de trabajo de aprobación. ¿Cómo puede el cliente aprobar la creación de un nuevo Objetivo Estratégico? SSM no permite al usuario realizar esta tarea y nuestro cliente planteó este tema como un riesgo. El flujo de trabajo para los componentes estratégicos se convirtió en un requisito a partir de ese momento. Nos pidieron que usáramos perla negra K2, que para nosotros era como una caja negra. Decidimos entonces fusionar nuestros equipos y dividir el trabajo para lograr el mismo objetivo.

Hemos creado un modelo de datos SSM simplificado que reduce el número de tablas necesarias para crear un Balanced Scorecard y lo conectamos a SSM. Desde nuestra interfaz pudimos rellenar cualquier componente estratégico, así como el cubo (utilizando comandos IDQL). A continuación, creamos la base de datos y un ETL dedicado (con SAP BO Data Services) que estaba poblando las tarjetas de puntuación equilibradas.

En el otro lado del escritorio, nuestro cliente estaba construyendo el flujo de trabajo en K2, creando las nuevas páginas web que ahora están reemplazando la herramienta de administración de SSM y conectando la salida directamente a nuestras tablas de interfaz.

Nos tomó un tiempo antes de que tuvimos la oportunidad de ver algo que estaba realmente trabajando, pero lo hicimos; Hemos creado una potente interfaz que crea cuadros de mando equilibrados dentro de SAP SSM.

En esta interfaz todo se ejecuta automáticamente, los KPI así como las perspectivas, los objetivos, las iniciativas y también los hitos son actualizados por un trabajo planificado de ETL en SAP BusinessObjects Data Services.

La personalización que hicimos se puede resumir de la siguiente manera:

  • Normalización y reingeniería de tablas SSM (después de realizar un análisis específico en el modelo de datos SSM) para crear nuestro DB de interfaz.
  • Conexión de nuestras tablas de interfaz a las tablas SSM.
  • Personalización de los trabajos IDQL estándar que están actualizando los cubos SSM.
  • Hacer que SSM sea de sólo lectura para evitar cambios en iniciativas o hitos de la interfaz de usuario final.
  • Hacer que las tablas de interfaz de SSM estén disponibles para el reporting y el dashboard ya que pueden ser incluidas en un universo simple.

Hasta ahora la única intervención manual que el cliente necesita hacer es crear los mapas de estrategia. Este paso se debe hacer desde la herramienta de administración SSM.


Para concluir, la solución que hemos explicado anteriormente se ha creado como una personalización, pero puede adaptarse a cualquier cliente que necesite este nivel de seguridad y detalle para su implementación SSM.

Parte de esta implementación podría aplicarse a las empresas que necesiten tener una cesta automatizada de KPIs que no incluya ninguna entrada manual para los valores (la parte final de esta solución puede ser considerada como un conector SSM DB). Esta solución se ha desarrollado utilizando SQL Server 2008, pero puede conectarse a cualquier fuente de datos (por ejemplo, SAP R / 3, ORACLE DB, archivos planos, etc.).

Si crees que esta solución podría funcionar también para tu empresa o tus clientes, no dudes en ponerte en contacto con nosotros por correo electrónico en info@clariba.com o dejando un comentario a continuación.

Cómo mover contenido en BusinessObjects BI 4.0 con control de versiones mediante LCM

En SAP BusinessObjects BI4, SAP nos proporciona una aplicación mejorada de LifeCycle Management (LCM) para implementar el contenido. Esta versión cuenta con nuevas funciones útiles para mover nuestros archivos entre servidores o directamente entre los repositorios de BusinessObjects XI. Las mejoras incluyen aspectos como la seguridad, la capacidad de recuperar diferentes versiones de documentos, la capacidad de salvaguardar la información y proporcionar control interno sobre los cambios que se hacen y quién los ha hecho.

También es importante tener en cuenta que con el lanzamiento de BI4, el Asistente de importación (la herramienta utilizada hasta esta versión) ya no funciona para desplegar contenido entre dos servidores BI4; Sólo funciona para actualizar desde una versión anterior.

Una de las nuevas características más importantes de LifeCycle Management es que puede importar categorías, así como otros tipos de objetos, tales como: Information Designer, Pioneer, Crystal Reports (próxima generación), Events y Xcelcius Enterprise.

Otra mejora es la nueva versión de archivo exportable: LCMBIAR, que contiene una estructura de archivos mejorada adaptada a estas nuevas características. El componente Trabajo nos permite definir un conjunto de objetos a transferir en formato LCMBIAR. Podemos agrupar estos trabajos en carpetas para mantener el contenido organizado en departamentos. Sin embargo, si los dos servidores están en la misma red, los archivos también se pueden migrar directamente de una plataforma a otra.

Para crear un nuevo trabajo necesitará definir: nombre, carpeta, origen y destino. Opcionalmente, pero recomendado puede agregar descripción y palabra clave.

Menú LCM
Menú LCM

En el trabajo puede seleccionar los objetos que se incluirán en los archivos LCMBIAR y, a continuación, hacer clic en "Administrar dependencias" para agregar elementos relacionados con los objetos seleccionados anteriormente. Por último, debe hacer clic en "Promover" para configurar los ajustes de trabajo.

Panel de Promoción

En el panel Promover podemos encontrar cuatro opciones:

  • Resumen: compruebe los nombres de origen y de destino para asegurarse de que el archivo se está moviendo desde la fuente correcta hasta el destino correcto, cambie la ID de administración.
  • Configuración de seguridad: marque esta opción cuando desee liberar la seguridad de los archivos.
  • Prueba Promover: utilice esta opción para asegurarse de que no habrá errores durante la conversión.
  • Horario de trabajo: Esto es para planificar la tarea de promoción para más tarde, muy útil si no está disponible para hacerlo manualmente, por lo general en los horarios fuera de la oficina.

Revertir

La nueva característica Rollback merece una mención especial. Nos permite comprobar las diferentes versiones de un conjunto de conversiones y, en caso de errores, volver a una versión estable anterior y, por lo tanto, evitar cualquier riesgo para el proyecto.

Antes de iniciar una restauración, debe asegurarse de que el estado del trabajo sea uno de los siguientes:

  • Éxito
  • Fracaso
  • Éxito parcial

El estado del trabajo se refiere a la versión actual del sistema.

Puede acceder al historial de trabajos desde la pgina de inicio después de iniciar sesión en LCM. El historial de tareas muestra la lista de todas las versiones anteriores del trabajo seleccionado. Tenga en cuenta que sólo puede volver a la instancia anterior más reciente.

Para restaurar la instancia más reciente, haga clic en la casilla de verificación y, a continuación, presione el botón Deshacer.

Puede elegir entre dos opciones de reversión:

  • Rollback completo: restaurará el sistema de destino a su estado anterior antes de que se promoviera el trabajo
  • Reversión parcial: le permite revertir un conjunto de objetos de información incluidos en un trabajo seleccionándolos en su lista de objetos.

En resumen, la práctica función Rollback establece la última instancia como la versión actual del sistema y activa la instancia anterior para su reversión si es necesario.

Conclusión

En resumen, la aplicación de LifeCycle Management mejorada es la mejor opción para liberar sus documentos del desarrollo a la producción en SAP BusinessObjects BI 4.0. Si tiene preguntas sobre este método, o si desea compartir su experiencia o sugerencias, no dude en dejar un comentario!

Escala dinámica en WebI para gráficos combinados

La escala en gráficos para WebI es algo que puede dejarse como automática o puede ser codificada mediante la introducción de cifras. Sin embargo, siempre es preferible seleccionar la configuración automática por las dos razones siguientes: en primer lugar porque cuando se agrega un nuevo valor al gráfico, no se descompone y, en segundo lugar, si el gráfico se encuentra dentro de una sección, el usuario Siempre disfrutarán del tamaño óptimo del gráfico. Pero la escala automática tiene un problema cuando se trata de gráficos combinados. Por ejemplo, si lo que queremos comparar con el eje Y y Z necesita estar en la misma escala, WebI crea dos escalas diferentes. Para ayudarle con este reto, este artículo le mostrará una solución para que pueda tener escalas idénticas para todos los ejes de gráfico, preservando la característica dinámica nativa de la escala.

La solución Let's imagine the example of a combined graph with bars and lines. And imagine that your sales department wants to see the sales in bars and the target in lines, in a monthly evolution. The chance that the bars and lines will have the same scale is low, because targets normally are higher than the sales. As a result users cannot compare both pieces of information, even if they are shown in the same units.

Una solución para llegar a ver objetivo y ventas en la misma escala es la siguiente:

  1. Crear una medida con el valor más alto por mes de las ventas
  2. Crear una medida con el valor más alto por mes de los objetivos
  3. Calcular el valor máximo entre los dos
  4. Asigne este valor ficticio en el último mes del gráfico y guárdelo en una nueva medida
  5. Arrastrar y soltar esta última medida en ambos ejes (Y y Z) y pintar el resultado en el mismo color que el fondo, por lo que no se ve

El resultado

El gráfico tendrá la siguiente apariencia:

Fig. 1. La misma escala optimizada para los ejes Y y Z también se aplica con las Secciones

Tenga en cuenta que si decidimos ir por las líneas de cuadrícula, éstas tendrán un pequeño defecto cuando se trata del lugar donde se muestra la barra ficticia. Este es un pequeño precio que tienes que pagar por la gran funcionalidad conseguida, pero quita la rejilla si lo prefieres y el resultado será absolutamente profesional.

Conclusión This workaround adds value to the user who is looking for two measures being compared graphically and wants to always have the optimal data size automatically. If you have questions about this method, or if you want to share your experience or tips, please feel free to leave a comment!

EspañolEnglish