La escala en gráficos para WebI es algo que puede dejarse como automática o puede ser codificada mediante la introducción de cifras. Sin embargo, siempre es preferible seleccionar la configuración automática por las dos razones siguientes: en primer lugar porque cuando se agrega un nuevo valor al gráfico, no se descompone y, en segundo lugar, si el gráfico se encuentra dentro de una sección, el usuario Siempre disfrutarán del tamaño óptimo del gráfico. Pero la escala automática tiene un problema cuando se trata de gráficos combinados. Por ejemplo, si lo que queremos comparar con el eje Y y Z necesita estar en la misma escala, WebI crea dos escalas diferentes. Para ayudarle con este reto, este artículo le mostrará una solución para que pueda tener escalas idénticas para todos los ejes de gráfico, preservando la característica dinámica nativa de la escala.
The Workaround Let's imagine the example of a combined graph with bars and lines. And imagine that your sales department wants to see the sales in bars and the target in lines, in a monthly evolution. The chance that the bars and lines will have the same scale is low, because targets normally are higher than the sales. As a result users cannot compare both pieces of information, even if they are shown in the same units.
Una solución para llegar a ver objetivo y ventas en la misma escala es la siguiente:
- Crear una medida con el valor más alto por mes de las ventas
- Crear una medida con el valor más alto por mes de los objetivos
- Calcular el valor máximo entre los dos
- Asigne este valor ficticio en el último mes del gráfico y guárdelo en una nueva medida
- Arrastrar y soltar esta última medida en ambos ejes (Y y Z) y pintar el resultado en el mismo color que el fondo, por lo que no se ve
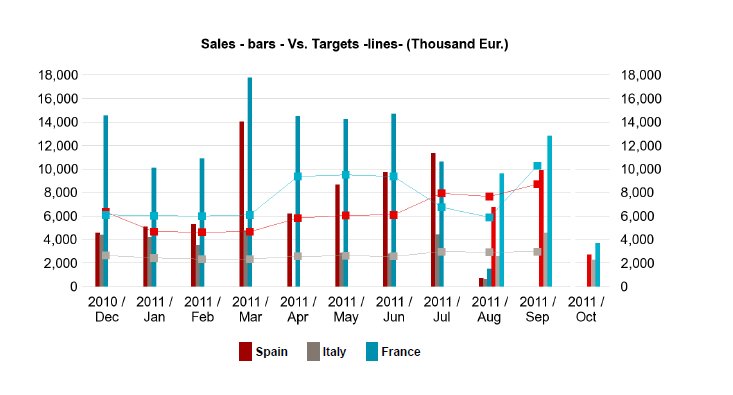
El resultado
El gráfico tendrá la siguiente apariencia:
Tenga en cuenta que si decidimos ir por las líneas de cuadrícula, éstas tendrán un pequeño defecto cuando se trata del lugar donde se muestra la barra ficticia. Este es un pequeño precio que tienes que pagar por la gran funcionalidad conseguida, pero quita la rejilla si lo prefieres y el resultado será absolutamente profesional.
Conclusion This workaround adds value to the user who is looking for two measures being compared graphically and wants to always have the optimal data size automatically. If you have questions about this method, or if you want to share your experience or tips, please feel free to leave a comment!

