""

Technical

Nuevo diseño de WebIntelligence ™ en XI 4.0 (segunda parte)

In my previous article I gave an overview about the new features and the enhancements in the design and layout of the new release of WebI XI 4.0. In this article I will continue explaining these changes and what they involve.Let’s start by looking at the design area, where we find 5 tabs on the top of the application (“Report element”, “Format”, “Data access”, “Analysis” and “Page Setup”).

The new WebI XI 4.0 tries to centralize similar features in a more logical manner. In such way, under “Report Element", we find the basic elements for the initial design.

This section is divided into 3 areas, where initially we’ll find these tabs: “Table”, “Cell” and “Section”. We won’t find any new characteristic added here, though a significant change lays in the way we interact with the elements.

What is worthy of mention is that we can now insert elements into a table in the habitual drag & drop way or by simply using a new interface to set any of them more rapidly.

The second section is focused entirely on “Charts”. This area has undergone major improvements and we now have many more graphic options to work with. WebI includes new chart types, new properties and other features developers have been expecting for quite some time.

The third section instead is based on how we allocate the report elements. We will therefore find the regular “Turn Into”, “Set as section”, “Order”, “Align” and “Hyperlinks” functions.

Apart from these three sections, if we click on an active report element, a new section pops up complementing the options that are available to us when right clicking over a report element. For example, if we click on a table, we can set up the Breaks or Insert/Remove Rows.

In the "Format" tab we now have a better distribution of all options which are now centralized and easy to access in order for us to format in any aspect our element. Previously all these options were spread across the report and accessed either by right clicking on the element or by selecting from the formatting bar or the “Data” tab.  Moreover, what I believe is well worth of mention is that WebI now adapts dynamically to each formatting option that fits with the selected item. In other words, if we select a cell, the tab is adjusted to modify multiple cell parameters; the same stands for table, report etc.

In the "Data Access" tab we find all the options related to data access and data manipulation. The first section involves working with the query panel (“Data Providers”). We can now create new queries to new data sources. It basically adds a new query to our document with the selected data source. Alternatively, we can edit one of the active queries, do a data purge or even refresh it. Under “Tools”, instead, we can change the data source specifically for one of the active queries or export the data to a flat file, CSV or PDF. The second section called “Data Objects” is where we can create our report data variables or merge specific dimensions.

Under the "Analysis" tab, the related functions are much more consistent. This is the case, for example, if we want to filter the data; now individual reports like “Filters”, “Ranking” or “Input controls” are grouped in one same block. Still under “Analysis” we find “Data Tracking” with no significant developments. The "Breaks" and "Sorts" options are centralized aswell, now grouped under "Display". Special mention goes to the “Conditional” tab, which includes a feature, legacy from the former WebI: “Alerters”. Finally, we can move on forward to the last set of options under the ”Interact“ tab where we’ll find the “Drill”, “Filter Bar” and “Outline” options and, as for the “Functions” tab, we’ll find the default aggregation functions such as sum, count, min, max etc.

The last tab to consider is named "Page Setup". This is one of the parts which I find particularly useful as it is more defined if compared with the old version.

Divided into three parts, the first block manages the reports. No new functionalities have been added here. The second block focuses on the distribution for each page of the report, defining the orientation and the page size, and the “Show/Hide” and “Height” for the header and footer. Finally, in the third block we have a new feature called “Scale to Page” where we can adjust our items either in width or in height fitting them in single or multiple pages. Additionally we can also control the report margins as well as the page display by toggling between quick display and view page.

Last but not the least, we find three new menus “Reading”,”Design” and “Data” that are quite useful.

These are intended to be shortcuts to the three main actions that a developer would carry out in WebI offering different views for each action.  In case we want to evaluate the report results, all we need to do is right click on “Reading” and the “Summary View” will appear along with the report results. If we want to go back to the creation area, we simply click on “Design” and it will display the canvas either in structure mode or populated with data. Finally the “Data” shortcut shows us a nice overview of all the data providers involved in our queries.

I hope you found this second part of my article helpful and insightful. Don’t hesitate to leave a comment or to ask any questions related to the new WebI 4.0 layout and I will readily reply to you.

Nuevo diseño de WebIntelligence ™ en XI 4.0 (Primera parte)

After a long time working on developing reports either with Deski or WebI documents on the old XI 2.0 and XI 3.0 platforms, I was eager to see what new functionalities SAP was able to offer us with the new releases of BusinessObjects 4.0. There are many articles that illustrate the main new features, but I couldn’t find any that would show how the tool looks like and what the real capabilities and functionalities are for a developer. This is the exact and main purpose of this first article; to give real insight into the new fancy application web version in terms of layout.

First and foremost, it is important to clear out the confusion generated around the nomenclature of Web Intelligence. Previously SAP had considered changing this from Web Intelligence to Interactive Analysis; this is why installer name and documentation refer to it as Interactive Analysis. SAP has decided to maintain the original nomenclature and so we shall continue referring to this application as Web Intelligence (WebI).

Web Intelligence

As soon as we select the “Interactive Analysis” button, the application is launched. It is interesting to note that a new tab called “Interactive Analysis” is added to the BI Launch Pad (formerly known as InfoView), next to the regular Home and Documents tabs.

The tab itself offers 3 possibilities, close, pin the tab, and open a new window to maximize the working area. This option is perhaps the most interesting of all as it responds to the long-standing demand from behalf of developers, to be able to work on a larger canvas area without having to pre-configure global options in the BI Launch Pad.

Below the tab we find a greyed out bar with the usual properties for editing and formatting as well as a drop combo box (Interactive Analysis) that will prove to be really helpful to manage the different bars and panes. Momentarily, we can only interact with the “new”, “open a document”, “user preferences button” and “help button”.

The user preferences button offers a new feature on the web version of WebI called "Manage BI services" used to manage the web services available in the hosts. It is also interesting to see that we can open a new a document from the server, either from a folder or a category.

If we decide to create a new document, the application prompts us to create a new data provider by selecting the data source it will be based on. The options available are “no data source”, “universe”, “BEX” and “Analysis View”.

Web Intelligence 2

The new and most significant options amongst these are “BEX” and “Analysis View”. BEX (acronym for Businness Explorer queries) is used to retrieve data directly from the queries mounted on the Infocubes from  SAP BW environment. Instead, View Analysis uses the results from an Analysis workspace, exported as an analysis view and created within an OLAP source system. I highly recommend the reader to explore these possibilities in forthcoming posts.

In this post I will use the everlasting universe efashion as an example.

As you can notice in the below illustration, the query panel isn’t any different from the old query pane in terms of layout.  It is still based on the same interactive functions and we can continue playing with the options to show or hide panels. The main new feature is the data preview panel which provides us with a first preview of the data depending on the objects dropped.

Minor changes are worth being taken into consideration such as for the “SQL” button that has now become the “View Script” button, or the reshaped “Master Perspective” drop down box that basically enables to display the objects sorted by class or by hierarchy. A new handy and interesting option is the new “Close” button offering us the possibility to choose between applying changes and closing or reverting changes and then close.

However the major enhancement of the query panel is one that is not visible. The outstanding feature is that now we can add new multiple queries to our document combining different data sources  (other universes, queries or analysis BEX View) answering a fundamental request from Webi developers.

Web Intelligence 3

The real feel of this being a new product release comes when we run a query and we use the new design mode. The first impression we have is that WebI is in line with the layout of the newest Microsoft Office products. The WebI canvas has experienced a total revolution. The static old bars have made way to a much more logical design using integrated tabs distributed throughout the application, which improves tremendously the usability for the developer. At a first glance, we can identify two main parts, the navigation area and the creation area.

WebIntelligence 4

Let us focus on the navigation area; this too is mainly divided into two parts. The first is the historical file menu where we can create, open, save, and print documents…nothing new. The second is a more centralized area where we can set up global properties at both document and application level. This last level is segmented into 3 parts. The first is the "View" menu, where we can show and hide all toolbars, tabs and panes. Now, we also have the possibility to expand to full screen.  In short, WebI has now more options centralized than the previous versions, which were distributed across the report and the query panel.

Web Intelligence 5

Finally under "Application" we find the same “user settings” present in the previous version of WebI, where we can set up the Measurement unit and the Grid properties.

Still, in the previous WebI, we used to have five tabs on the left hand side of the canvas (Map, Templates, Properties, Data and Input Controls). Now, in the latest WebI version, this part has been totally renewed. This new area is more focused on navigation and customization of the global document rather than the report elements. The first is the summary document which outputs a summary of the main options established in the WebI document. An interesting new option within this section is an area where you visualize the prompts parameters defined in the doc as well as the KeyData. The next two icons correspond to a new partition of what we used to find in the old “map” tab: report map and document structure and filters. Input controls and Available objects (former “Data” tab) present nothing new. Finally the structure is completed with the web service publisher.

I hope you enjoyed this article and that it has allowed you to gain a better understanding of the new WebI layout. Stay tuned for the second part of this article for more insight on what’s new in WebI.

Don’t hesitate to leave a comment or ask for clarifications and I will readily reply to you.

Liberación de SAP Business Objects XI 4.0: Conexión a orígenes de datos OLAP

En marzo, la nueva versión de SAP Business Objects 4.0 llegó a la escena con un montón de nuevas características interesantes. Hoy voy a describir cómo configurar una conexión a un origen de datos OLAP utilizando algunas de las nuevas herramientas y características de SAP Business Objects XI 4.0. Para seguir correctamente las instrucciones descritas en este artículo, lo mejor es asegurarse de que se cumplen los siguientes requisitos previos:

  • Windows Server 2008. La configuración del servidor debe habilitarse como rol de servidor Web (IIS).
  • SAP Business Object XI 4.0.
  • SQL Server 2008 y Microsoft Analysis Services. Se debe instalar la base de datos de ejemplo "Adventure Works" y los ejemplos del cubo OLAP implementados en Microsoft Analysis Services.

Configuración de la conexión OLAP

En primer lugar, para que pueda crear una conexión OLAP tendrá que configurar IIS para proporcionarle el acceso al cubo OLAP almacenado en Microsoft Analysis Services.

Configuración de IIS

Simplemente sigue estos pasos y estás en camino:

1. En primer lugar creamos una carpeta llamada "Olap" en la ruta raíz de IIS en la máquina, por defecto la ruta debería ser: C: inetpubwwwroot

2. Copie los archivos necesarios para crear la conexión con Analysis Services. Estos archivos, que se establecen como una instalación predeterminada de SQL Server 2008, se almacenan en la ruta de acceso siguiente:

C: ProgramFilesMicrosoftSQLServerMSAS10.MSSQLSERVEROLAPbinisapi.

Copie todos los archivos contenidos en esta carpeta y péguelos en la carpeta "Olap" que hemos creado en el paso 1.

En este punto, esto es lo que deberíamos ser capaces de visualizar:

XI4
XI4

3. Inicie Administrador de Internet Information Services (IIS). Lo encontrará en el Panel de control en Herramientas administrativas.

SAP XI 4
SAP XI 4

4. En el panel Conexión, abrimos el árbol de sitios. Hacemos clic derecho en Pools de aplicaciones y seleccionamos la opción Agregar grupo de aplicaciones.

SAP XI 4 (2)
SAP XI 4 (2)

5. Así es como debe aparecer la configuración de la piscina:

SAP BO XI4
SAP BO XI4

6. Ahora, dentro de la lista de Piscinas de Aplicaciones disponibles para nosotros, podemos ver la piscina de Olap. Simplemente haga clic con el botón derecho del ratón en la piscina de Olap y seleccione Configuración avanzada. Una vez que hayamos alcanzado este ajuste, es sumamente importante que establezcamos la opción "Habilitar 32 -bits Application" en FALSE. Este es un paso crítico porque, a menos que esta opción esté establecida en FALSE, la conexión no funcionará.

SAP BO XI4
SAP BO XI4

7. Seguimos haciendo clic derecho en el sitio de Olap y seleccionando la opción Convertir en Aplicación.

SAP BO XI4
SAP BO XI4

8. En la ventana de configuración, pulsamos el botón Seleccionar y seleccionamos el grupo de aplicaciones que se ha creado. Así es como debería aparecer la configuración:

SAP BO XI4
SAP BO XI4

9. Ahora seleccione el sitio Olap en Conexiones. En el panel derecho podremos ver diferentes categorías. Haga doble clic en Asignaciones de manejador.

10. En la parte superior derecha del panel ahora podrá visualizar el panel de Action. Desde aquí, seleccione Agregar mapa de scripts. Aparecerá un panel de configuración, y así es como debería aparecer:

XI4
XI4

11. Ahora procedemos a configurar la Configuración de Autenticación. Haga clic en Conexiones en el sitio de Olap y haga doble clic en la categoría de autenticación que se encuentra en el panel derecho.

12. En el panel derecho puede ver ahora los tipos de autenticaciones disponibles. Haga clic derecho en Autenticación de Windows y habilitar.

SAP BO XI4
SAP BO XI4

Configuración de Analysis Services 2008

Now our following step consists in configuring the Analysis Services which means having to modify the security settings. This is why if you follow the instructions in this article to setup a production environment please check your security implications. For more information on this matter please click here.

1. Inicie SQL Server Management Studio y conéctese a su servidor de Analysis Services

2. Haga clic derecho en el servidor y seleccione Propiedades.

XI4
XI4

3. En el panel izquierdo seleccione la opción Seguridad. En el panel derecho podemos ver Server Administrator. Haga clic en el botón Agregar en la parte inferior izquierda de la ventana.

4. Escriba el nombre IUSR en el cuadro y presione Verificar nombres. Finalmente presione OK.

5. Ahora podemos ver la cuenta IUSR en la lista de administradores del servidor.

XI4
XI4

Conectar SAP Business Objects XI 4.0 a OLAP

Hay varias formas de crear una nueva conexión en SAP BO 4.0 y acceder al cubo OLAP. En este artículo vamos a enfocarnos en el uso de una nueva herramienta introducida en SAP BO 4.0 llamada Information Design Tool (IDT). El IDT es el entorno de diseño de SAP Business Objects para crear y publicar nuevos universos y conexiones de SAP Business Objects. Para finalizar el proceso, crearemos un nuevo universo OLAP utilizando la herramienta de diseño de Universo y, por último, crearemos un informe sencillo con Web Intelligence 4.0 que nos permitirá probar el acceso al origen de datos.

Creación de la conexión OLAP

Proceda de la siguiente manera:

1. Iniciar la herramienta de diseño de información

2. Cree un nuevo proyecto, vaya a Archivo, Nuevo y luego Proyecto

3. Introduzca el nombre del proyecto, la ubicación (opcional) y pulse Finalizar

4. Vaya a Archivo, Nuevo, OLAP, Conexión para comenzar a crear la conexión con el origen de datos OLAP.

5. Introduzca un nombre para la conexión, una descripción (opcional) y pulse Siguiente

XI4
XI4

6. En la siguiente pantalla tenemos que seleccionar el controlador para la conexión, en nuestro caso Microsoft Analysis Services 2008, y presionar Siguiente

7. Introduzca los parámetros de la conexión, esto es lo que debe visualizar:

XI4
XI4

8. Seleccione el cubo para la conexión y pulse Finalizar.

XI4
XI4

Si ha logrado éxito en su tarea gracias a seguir estos pasos, ha sido capaz de crear una nueva conexión y ahora todo lo que queda es para usted es publicar esta conexión en BO. Así es como se hace.

1. Haga clic derecho en la nueva conexión y seleccione la opción Publicar conexión a un repositorio

2. Introduzca las credenciales para conectarse al repositorio de BO y pulse Conectar

3. Seleccione una ubicación para la conexión y pulse Finalizar.

Creación de un universo OLAP

Para fines de prueba vamos a crear un universo OLAP utilizando la nueva conexión.

1. Inicie Universe Design Tool e ingrese sus credenciales para acceder al servidor

2. Ir a Archivo, de allí a Nuevo

XI4
XI4

3. Introduzca los parámetros del universo, seleccione la conexión creada y pulse OK. Así es como debe aparecer:

19
19

El universo cargará automáticamente la estructura y los objetos del cubo.

XI 4
XI 4

Creación de un informe Web Intelligence

Una vez que todo esto se ha hecho, veamos la creación de un Informe de Web Intelligence:

1. Iniciar Análisis interactivo de escritorio

2. Seleccione el Universo

XI 4
XI 4

3. Introduzca las credenciales para acceder a su servidor BO

4. Seleccione el universo creado y presione Seleccionar, en nuestro caso el ejemplo de conjunto es OLAP Universe

5. Cree una consulta y pulse Ejecutar consulta.

XI 4
XI 4

En esta etapa, después de haber seguido estos pasos con precisión, debemos ahora tener un nuevo informe que se muestra delante de nosotros, lo que nos permite utilizar el Universo que hemos diseñado con la conexión OLAP, para acceder a la información en el cubo almacenado en Analysis Services 2008.

XI 4
XI 4

Espero que haya encontrado este artículo de su interés y para cualquier sugerencia o consulta sobre SAP Business Objects XI 4.0 por favor deje un comentario y le responderé gustoso.

Haciendo la paz con el enemigo: SAP BusinessObjects Live Office XI 4.0

El escenario más común al que me he enfrentado hasta ahora, después de algunos años dando presentaciones de preventa de BI e implementando sistemas de BI para clientes, ha sido el de reunirme con miembros de un departamento de TI sobrecargado que dirigen sus esfuerzos para desarrollar informes complejos con Herramientas de BI para un grupo de usuarios empresariales que, al final, simplemente exportarán la información que se les entregó a una hoja de Excel y trabajarán directamente en ella.

For decades, most BI vendors have tried to convince users to give up Excel sheets and instead work with more flexible and user friendly BI tools. But it’s an acknowledged fact that nowadays millions of people around the world use spreadsheets on a daily basis. The time has come for vendors to take off their blinders and to act upon what is happening. Already some have been readjusting their strategies and roadmaps, and have shifted towards accepting Excel as a presentation layer for data thereby providing the necessary integration with it.

This article is about how SAP BusinessObjects tackles this challenge and goes one step further in terms of tools integration thanks to the new features of the latest release XI 4.0.

With Live Office, it is possible to insert content from Web Intelligence, Crystal Reports and also Universe Queries directly into Microsoft Office documents (PowerPoint, Word, Excel or Outlook). Furthermore, when opening the very document at a later time, it is possible to refresh the embedded objects and retrieve up-to-date data in the document.

This is truly an advantageous solution and I have had the opportunity to use this technology with some customers, who continue employing their traditional form of reporting with an Excel sheet but can now combine this with error-free data obtained directly from their business systems.

In the latest release of Live Office, a new functionality loads the data selection of Microsoft Excel to SAP BusinessObjects Explorer, a flash-based tool that allows further analysis in a very visual and intuitive way. Moreover, the results from a completed analysis can also be downloaded to other applications, such as Outlook and PowerPoint to further the study or to simply send by email.

Live Office XI 4.0

If you have any questions regarding Live Office XI 4.0 and its uses in a customer environment, feel free to leave a comment and I will follow up with you.

Cómo organizar una reunión entre dos parientes que no se conocen entre sí: conectando Strategy Management con Data Services

As promised in our previous SSM article, I will now walk you through another interesting objective we have achieved while working on our SSM project: populate Strategy Management KPIs with a Data Services job.

Currently SAP BO SSM does not provide a connector to SAP Business Objects tools even if both SSM and Data Services are SAP BusinessObjects products.

The solution we designed for our customer in UAE provides them with the option of loading the data from any source into SAP BO Data Services and of finally dumping the values into an SSM PAS Cube (via E&A PAS schedule).

The solution recommended by SAP for its latest version currently in use, SSM7.5 SP08, allows loading the data into the PAS cube by creating an IDQL script.

The concerns we were faced with in our project were related to the actions required for the maintenance of IDQL (scripting language).

For a non-trained customer, IDQL sounds like a black box and sets off many alerts especially when it comes to maintenance.

I was caught in the midst of a question storm which ended thanks to our “problem solving attitude” and rapidly blew off all questions.

It didn’t take us long to learn how the SSM data model works for the KPIs as we had already studied them while working on the initiative.

The first step taken consisted in creating a cube in the SSM “Cube Builder” console. From here we proceeded to mapping the KPIs ID that we have in SSM SQL and in our original source (i.e. ERP, Excel, and Other DBs).

The process of creating a source and sending it out with a data integrator was a straightforward and pleasurable task and has delivered great results.

Now, this solution allows me not only to insert the current data but to introduce the historical data just as well, it’s absolutely fantastic!!!!

I was able to visualize in my “Entry and Approval” panel the data I was inserting on an excel file and on the ERP tables.

At this point my data was not added into the “Balance Scorecard” yet, so the last action I had to perform was that of publishing those values.

I used the “Entry and Approval” scheduler that was running right after the ETL job.

Reached this stage, I had my SSM Context populated with my values.

In the image displayed below I have outlined the steps we followed (IDQL is marked in red since it hadn’t been utilized throughout this process) and as you can clearly notice, we are now capable to create reports and dashboards from the SSM Database by generating a universe on top of the SSM tables. 

Integrating SSM with Data Services

  Please don’t hesitate to contact us at info@clariba.com for more information about this article or for SSM consultancy.

Loading Status Animation in Xcelsius

A menudo, al desarrollar un panel de control con Xcelsius, tenemos conexiones a una base de datos, ya sea con LiveOffice o QaaWS (Query as a Web Service). Esto nos deja con solo dos opciones para actualizar nuestro panel de control: ya sea que procedamos una vez que todos los componentes de Xcelsius estén cargados o, alternativamente, cambiemos un botón de radio, un cuadro combinado o cualquiera de los componentes relacionados con los objetos de conexión. En ambos ejemplos, cuando tenemos que administrar grandes cantidades de datos, normalmente esperamos hasta que la conexión devuelva nuestra solicitud. Esto puede ser frustrante, especialmente cuando no tenemos ningún indicador para indicar que los datos se están procesando. En este artículo ilustraré una solución conveniente a este problema.

  • En primer lugar, necesitamos crear los objetos que se mostrarán mientras la consulta carga los datos: aconsejaría comenzar creando un rectángulo como capa falsa. Una vez hecho esto, creamos otra imagen que será nuestra animación.

Tenemos muchas animaciones posibles:

View the flash file: Loading Animations in Xcelsius

Así es como aparece la animación:

View the flash file: Xcelsius Animation

  • Luego agrupamos estos dos objetos y los llevamos al frente.

  • En una hoja de cálculo creamos una celda donde vinculamos el estado de la consulta.

  • Llegado a este punto, en propiedades en QaaWs o en la conexión de Live Office seguimos estos pasos:

En la pestaña Uso:

Sección de estado de carga:

  1. En la celda Cargando mensaje, codificamos una "L"
  2. En la celda Mensaje inactivo codificamos una "C"
  3. En la opción Insertar debemos mapear la celda de la hoja de cálculo, en nuestro caso "B1"

  • Finalmente seleccionamos el grupo que habíamos creado previamente, y en la ventana de visibilidad dinámica asignamos el Estado a la celda "B1" y la clave a una "L". Esto significa que mientras se carga la consulta, podemos ver simultáneamente el grupo.

El resultado final es como se muestra a continuación.

Esta estrategia contribuye a proporcionar un entorno amigable para el usuario, en particular en aquellas situaciones de recuperación lenta de datos.

Si tiene alguna pregunta o sugerencia sobre esta solución, no dude en dejar un comentario y con gusto le responderé.

Creación de documentos WebI dinámicos

A menudo nos vemos obligados a encontrar una solución para hacer que nuestros informes de Web Intelligence sean más dinámicos, debido a una necesidad específica del usuario o con el propósito de demos de ventas. En este caso podemos añadir algo de interactividad para hacer nuestras presentaciones más vivas y más visualmente atractivas. En esta publicación encontrará algunos ejemplos para obtener informes WebI más dinámicos que no vienen con el módulo estándar WebI estándar:

  1. Columnas dinámicas
  2. Ocultar y ocultar bloques
  3. Ocultar y mostrar bloques en secciones

Las técnicas explicadas a continuación son válidas no sólo para tablas sino también para gráficos.

1. Columnas dinámicas:

El propósito de esta técnica es cambiar el valor de una columna de dimensión de acuerdo con una selección de su control de entrada. A continuación encontrará las directrices de alto nivel para crear columnas dinámicas:

  • Crear una tabla ficticia en el Universo; Idealmente una tabla derivada con el nombre de las descripciones que desea que el usuario muestre y muestre en el documento. Puede ver un ejemplo a continuación:
Tabla Dummy WebI
Tabla Dummy WebI
  • Estas variables dinámicas deben aparecer en una Consulta separada y estar enlazadas con los datos reales procedentes de una segunda Consulta. Alternativamente, todos los datos podrían provenir de una sola consulta. Si las variables y los datos a presentar no están vinculados, nuestra solución no funcionará.
  • El siguiente paso es crear el control de entrada asegurándose de que el filtro aplicado afecta a todo el informe oa una tabla específica, dependiendo de dónde se encuentren las columnas dinámicas.
  • Once we have all this, we need to build the table or block where our "Dynamic Column" will be located and build a conditional formula with IF and ELSE features. Using our example, if our dynamic variable is called Input control, if the information we want to show is located in the Period table and if the dynamic source fields are Month, Week & Day, then the formula should be the following: =If("inputControl"="Month";[Period.Month];If("inputControl"="Week";[Period.Week];If("inputControl"=”Day”;[Period.Day]))) Make sure the formula sentence is properly defined so that a meaningful result will be displayed when the user applies the "All values" option.

For a more detailed explanation on this topic you can check the Clariba blog article:  How to Use WebIntelligence Input Controls Efficiently from 22 enero 2011 at www.clariba.com/blog.

2. Ocultar / Desbloquear bloques

  • El propósito de esta técnica es ocultar una tabla y mostrar otra con columnas de dimensión cambiando su valor según una selección de su control de entrada:
  • Cree una tabla ficticia (como en el ejemplo anterior) con las opciones que queremos mostrar al usuario y con el propósito de vincular dos consultas (es decir, con la palabra "LINK")
  • Cree una tabla con todos los datos que desea mostrar. Después de eso, es necesario desmarcar una de las propiedades que nuestro bloque / tabla tiene por defecto. Seleccione el bloque adecuado, vaya a propiedades, despliegue la opción "Mostrar" y asegúrese de que la propiedad "show when empty" no esté activa.
  • El siguiente paso es crear el control de entrada, asegurándose de que el filtro aplicado afecta a todo el informe.
  • Luego tenemos que jugar con los filtros de los diferentes bloques. El objeto con la palabra "LINK" necesita ser utilizado como un filtro para cada bloque (igual a). Después de eso aplicamos un filtro con el objeto que usamos antes para el Control de Entrada, asegurándose de que la opción para este filtro sea "no igual a" el valor que corresponde a la tabla real. Tenemos que hacer lo mismo con todas las tablas.

3. Ocultar / mostrar bloques en secciones:

Imagínese que tenemos un informe donde queremos dividir una tabla de tendencias en secciones que muestran las tendencias en "Meses", "Semanas" y "Días". La sección podría ser demasiado larga y el usuario no desea desplazarse hacia abajo para encontrar una determinada.

  • En este caso, haríamos tres tablas diferentes, una para los Meses, una para las Semanas y la última para los Días y colocarlas en la sección, asegurándose de que cambiamos los nombres en la parte superior de la tabla para que los usuarios puedan reconocerlos fácilmente .
  • Seleccione los diferentes bloques y desactive la selección "show when empty" de las propiedades. Cree tres controles de entrada diferentes con todos los valores, uno para cada tendencia posible. Establecer las conexiones entre éstos y su tabla correspondiente.
  • Asegúrese de que el control de entrada tiene un valor por defecto, por lo que sólo una tabla es visible. De esta manera, cuando el usuario hace una selección en un solo control de entrada "tendencia", el bloque correspondiente se mostrará correctamente; Mientras que si el usuario anula la selección de todas las opciones en las tablas de control de entrada, todos los bloques serán visibles.

Las técnicas explicadas anteriormente fueron desarrolladas por nuestro equipo de desarrolladores de Web Intelligence para proporcionar a los usuarios empresariales el valor agregado de la interactividad en sus consultas, análisis y navegaciones.

If you have any questions or feedback about these solutions, please feel free to leave a comment below or send an email to info@clariba.com

Informes de WebI fáciles de mantener

Creating Web Intelligence reports is not the most challenging task for a BusinessObjects consultant, but it can be very time-consuming. Imagine your client asks you to create one document with 50 reports, and he's not sure yet how the reports should look. How can you create all these reports and at the same time make sure that they're easy to update?

Esa es de hecho una pregunta muy importante. Imagine que ya ha creado los informes 50, uno en cada pestaña, y su cliente de repente decide que la etiqueta de los totales no debe ser "Total (1000 EUR)" sino más bien "Miles de euros". Y en lugar de este fondo gris que decidió utilizar de forma predeterminada, al cliente le gustaría tener su azul corporativo.

¿Qué sucederá si no lo pensaste (o leíste este artículo) antes? Terminará cambiando los informes 50 uno por uno. Ok, no debería tomar más de 60 o incluso 30 minutos, pero probablemente tengas un mejor uso de tu tiempo, ¿verdad?

As que echemos un vistazo a algunos consejos:

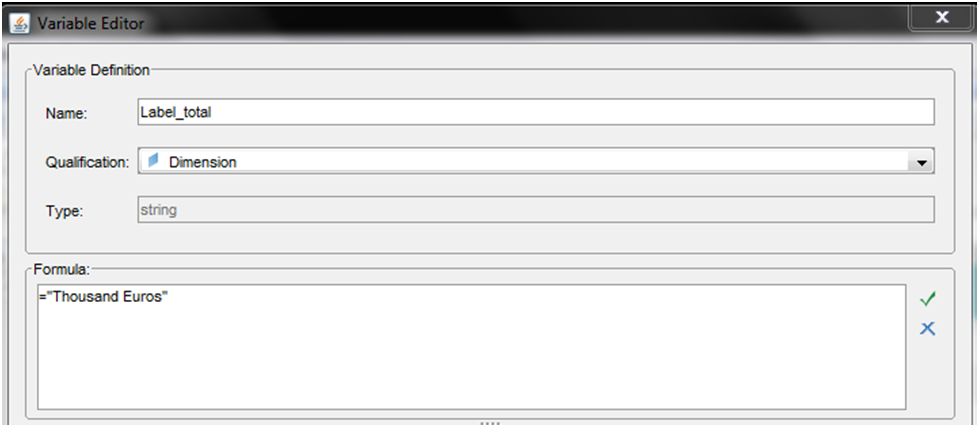
  • Use variables. The variables are not only quite useful for creating new measures, they're also great as labels. If you had created a variable Label_total (as a dimension) with the value "Total (1000 EUR)" and written in each total name cell "=[Label_total]", then the change would be quite easy. Just edit the variable and there you are! The label is now correct on your 50 reports.

  • Use alerters. Alerters are like "conditional formatting" in Excel. Define a condition, a format, and if the condition is met, then the cell with the alerter will be formatted. This is necessary when you really need formatting to depend on a condition, but it's also a useful tool for easy maintenance. For the condition, choose something always true (for example create a variable always equal to 1, and define the condition in the sub-alerter as "Is this variable equal to 1"). For the formatting, just choose how you want the cell to look (for example with the grey background). Apply this alerter to all cells which should have this background. Now, if you need to change the color, you only need to change the alerter, not all the cells in the 50 reports! Note that unlike in Excel you can also put text in the formatting. So you can actually also use alerters for labels; the downside being that you lose in clarity (you can have something written in the cell's formula and something else displayed because of the alerter).

Esperemos que esta publicación le haya proporcionado algunos consejos para ahorrar tiempo para sus informes WebI que también lo ayudarán a mantenerlos y actualizarlos fácilmente. Si tiene otros consejos de WebI para compartir, ¡no dude en dejar un comentario a continuación!

Instalación de Business Objects en Linux - Parte 1: Preparación del sistema

At Clariba we have seen a clear dominance of Windows operating systems during our Business Objects implementations. But what happens when we face the challenge of a Business Objects implementation on a Unix-like system? What are the main differences? How does the consultant need to prepare? What are the pre-requisites? What are the risks and possible ways to overcome them?

We were recently challenged with these questions and we wanted to keep track of this experience and share it with everyone. So I will share below some tips for implementing Business Objects on a Unix-like architecture, more specifically: Linux.

The intention of the first part of this article will be to focus on how to prepare your Linux distribution so the installation runs smoothly. I will follow up with a future article to go into additional details about the Linux setup.

Step 1 – Defining your environment

In any implementation, prior to execution, it is vital to define the scenario you will be facing. This is even more important when implementing on a Linux system. The most important fact you need to know is what type of Linux you will be using and if it is supported by Business Objects.

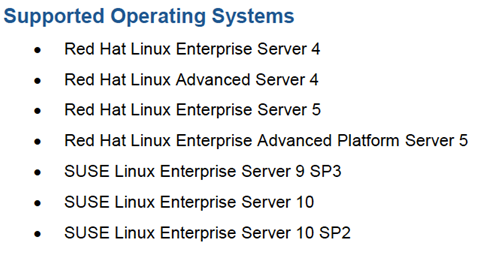
Officially the Linux distributions supported by Business Objects are Red Hat and SUSE (although other distributions like CentOS have also been proven to work due to similarities with Red Hat).

Linux Operating Systems

It is a must to go through the supported documents pdf for Linux available at the SAP Marketplace. In this document you will find specific details on the versions and patch level that you need to comply with in order to install Business Objects.

BOE XI 3.1
BOE XI 3.1

Paso 2 - Preparando la caja de Linux

Root Access and Installation User First of all you need to have root access to the system. Although this is not required for the setup, along the way there will be modifications that need to be made to the system that require root privileges.

Also make sure there is at least one additional user in the system. This user will be the executor of the Business Objects setup. Most current Linux distributions already create an additional user at setup.

Red hat enterprise linux 5

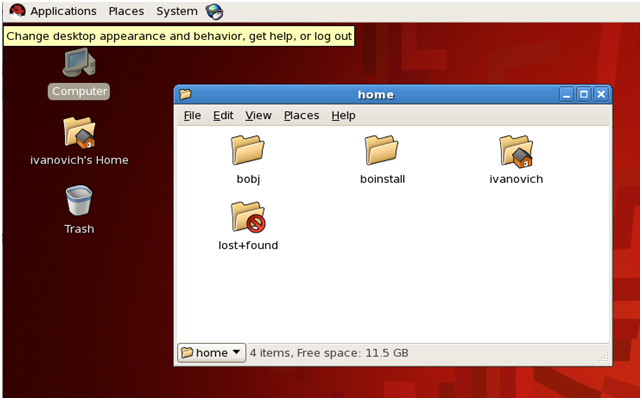
Install Files Download the installation files for Linux and save them on a folder that references the installation sources (i.e. /boinstall). Also create a new folder where the BO system will reside (i.e. /bobj)

Installing files in Linux

Modifying Your System Now it is time to get our hands dirty. The following modifications need to be made to your Linux system in order for the Business Objects installation to run smoothly. It is advisable to have a minimum level of knowledge around Linux administration and terminal console commands to facilitate the editing of some of the files mentioned below.

1) Modifying Locale variables The first thing you will need to do is to update a couple of locale variables. Navigate and open the file: /etc/sysconfig/il8n You need to add the following two lines to it:

LANG = en_US.utf8 export LC_ALL = en_US.utf8

What we are doing is correcting a small spelling mismatch on the US utf8 standard value. The above instructions on the file will ensure that those variables are correctly set at boot time. However they can also be run separately on a terminal console at any time.

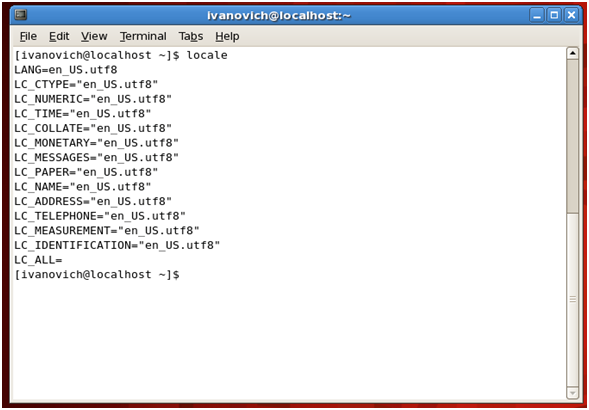
To make sure your variables are correctly set you can type “locale” on your terminal console. A listing with your available locale variables should pop up.

Modificación de variables locales en Linux

2) Permissions to Source and Install folders You will need to set execution and write permissions to the folders created previously for the source install files and the folder where the Business Objects system will reside. To do that you need to run the following commands on the console as root:

chmod -R 755 /boinstall /bobj chown -R usergroup:user /bobj /boinstall

Note that I’m using the folder names suggested earlier for the folders; usergroup:user is the default non-root user that would be running the installation and a default group it belongs to.

Be very careful with the spelling of these lines. Chmod is a powerful Linux command that could render your system unusable if not used wisely.

3) Setting up Hosts file Go to /etc/hosts as root and open this file for edition. You will need to add a line to resolve your Linux system IP through the network. It should look similar to the following:

192.168.0.1    linuxsystem

Ya debe haber una línea para 127.0. 0.1 que es la definición de la interfaz de red localhost o loopback. Guarde el archivo hosts con la nueva línea para su sistema.

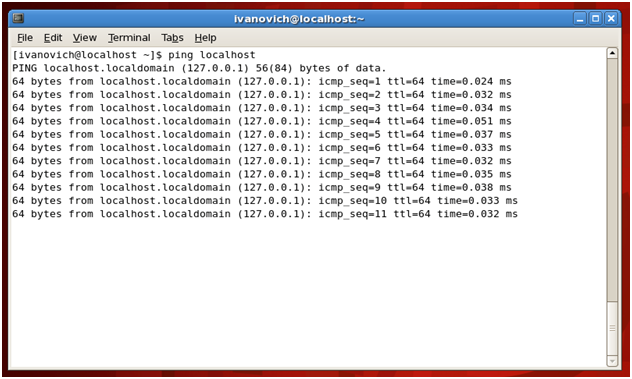
Para probar que la línea de los archivos hosts se ha configurado correctamente, intente ejecutar un comando ping desde la consola al nombre de su sistema:

ping linuxsystem

Debe recibir una respuesta si el archivo hosts se ha establecido correctamente.

Ping sistema Linux
Ping sistema Linux

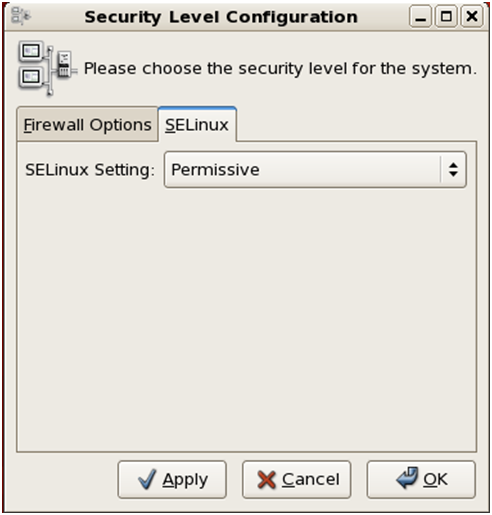
4) Disable SE Linux Still logged in as root, modify the SE Linux functionality. There are three levels for it:

  • Aplicación: el modo predeterminado que habilitará y aplicará la política de seguridad de SELinux en el sistema, denegando el acceso y las acciones de registro
  • Permissive: In Permissive mode, SELinux is enabled but will not enforce the security policy, only warn and log actions. Permissive mode is useful for troubleshooting SELinux issues
  • Disabled: SELinux is turned off
Configuración de nivel de seguridad

Deberá cambiarlo a Permisivo o Desactivado.

5) Adding libstdc++ libraries In some cases (CentOS) these libraries are not available by default. You can try to add them from the Linux repositories running the following command:

sudo yum install compat-libstdc++-33

This library can also be found on different places and formats on the web. If not installed, Business Objects setup will fail, indicating the missing library.

En resumen...

if you have completed the steps above, you are now ready to install Business Objects on your Linux box.

We will be covering the Linux setup in the second part of this article. Stay tuned for Part 2 coming soon and please feel free to leave questions or feedback below using our Comments form.

It is a must to go through the supported documents pdf for Linux available at the SAP Marketplace. In this document you will find specific details on the versions and patch level that you need to comply with in order to install Business Objects.

It is a must to go through the supported documents pdf for Linux available at the SAP Marketplace. In this document you will find specific details on the versions and patch level that you need to comply with in order to install Business Objects.

Cómo utilizar los controles de entrada de WebIntelligence de manera eficiente

Los controles de entrada proporcionan a los informes WebI la interactividad que necesita para la correcta selección de información, pero esta funcionalidad tiene un precio. Cuando la cantidad de datos manejados es alta, los problemas de rendimiento pueden aparecer durante los desarrollos. Para ayudar con este problema, recomendamos la siguiente técnica de diseño, que se puede utilizar para mejorar el rendimiento de su navegación interactiva.

Siga este proceso de pasos 8 para familiarizarse con esta solución:

  1. Crear un documento WebI con dos consultas: a) Una consulta que contenga el "cubo" con los datos que queremos monitorear junto con una cota [Link1] que contenga la palabra "LINK" yb) Otra consulta con dos dimensiones: [Input Controls List ] Que contenga una lista única * del objeto dinámico a utilizar y un objeto (Link2) que contenga la palabra "LINK" (* Puede utilizarse una tabla derivada que contenga valores codificados)
  2. Cree una dimensión fusionada (por ejemplo, [LINK]) que unifica las 2 dimensiones de enlace)
  3. Cree una variable de detalle denominada ICF (Indicador de control de entrada) con la fórmula [Input Control List] y utilice [Link1] como dimensión asociada
  4. Cree una variable de dimensión denominada X-Axis. Esto contendrá el objeto dinámico que se utilizará en los informes. Consiste básicamente en una sentencia IF grande, usando el [ICF] de la 2 nd query y los objetos que queremos usar como eje de la 1 st Query. Vea como ejemplo: = IF ([ICF] = "Unidad de Negocio"; [Unidad de Negocio]; IF ([ICF] = "Tipo de Cliente"; [Tipo de Cliente]; ...)
  5. Crear componentes en un informe (por ejemplo, una tabla y un gráfico), que contiene el eje X y la medida que deseamos mostrar.
  6. Cree el control de entrada con las siguientes características: a) Utilice la dimensión [Input Control List] b) En dependencias, seleccione los componentes (tablas, gráficos, celdas, etc.) que serán afectados por el control de entrada.
  7. Cree el siguiente filtro en cada componente que se va a realizar: [LINK] Igual a {'LINK'}
  8. Por último, pero no menos importante, en las propiedades del documento "Extender valores de dimensión fusionados". Esto es muy importante para la funcionalidad correcta de la solución.

Si queremos llevar esto al siguiente nivel y tener informes dinámicos completos, podríamos tener 2 controles de entrada adicionales, por ejemplo, un eje Y adicional y una medida. Para lograr esto sería suficiente crear 2 consultas adicionales con nuevas listas de control de entrada y seguir los pasos 2-7 para ellos. En el caso de la medida, es mejor utilizar las cláusulas suma / if en el paso 4. Una vez implementada, esta solución permitirá una fácil escalabilidad, ya que el nuevo contenido se puede agregar rápidamente con pocas modificaciones en la interfaz de front-end.

Si tiene alguna pregunta o comentario sobre esta solución, no dude en dejar un comentario a continuación o enviar un correo electrónico a info@clariba.com.

EspañolEnglish