""

Technical

How to convert a Universe to Multi-source in SAP BusinessObjects BI4

The new BI 4 offers a very powerful meta-layer capability: a single Universe can sit on top of several data-sources with great benefits offered by a real-time integration. At a first glance, you might think that existing Universes would need to be typed from scratch, but this article explains how to re-use an existing Universe to provide this highly scalable and expandable meta-layer.

The multi-source Universe

A multi-source Universe is now designed as a project with the following components:

  • CONEXIONES
  • Data Foundation
  • Capa empresarial

These items can be created and configured separately, and then be connected one with another. The cycle of creating a new Universe is easy because the connections, data foundation and business layer can be created intuitively and always using the common SQL language, so no need to know native connection peculiarities. Once built, what happens behind the scenes is transparent to the end user and he/she will see that Business Objects will produce a query which takes pieces of information from different sources in real-time.

However, while the creation process is quite simple when generating a new Universe from scratch, it is not so straightforward if we are migrating from a legacy universe. Let’s see why.

UNV to UNX conversion process

In our experience, the three steps to be completed are the following:

  • Legacy Universe (UNV) import: Using the standard migration process the legacy Universe can be inserted into the new BI4 platform. This can be done in a very short time and it has the following quick advantages:
    • Migrated Web Intelligence reports will still sit on top of this legacy meta-layer.
    • Live Office BI4, Crystal 2011 and other client tools can continue to perform as these are still using this format.

But we still cannot use platform modules like Explorer BI4 or Crystal Enterprise, or use the new security model or the new features advantages of the new Information Design platform, so the natural next step is to enable this.

  • New Universe (UNX) conversion: From the Information Design tool we will click on File, “Convert .unv universe” and a new UNX universe is provided, with a project containing the three main items: Connection, Data Foundation and Business Layer. The advantages are the ones we previously stated, but there is one big disadvantage: The automatically generated Data Foundation is mono-source type, so the resulting Universe will not be scalable, and there is no easy way of turning a Data Foundation from mono to multi-source. Therefore this will need to be re-built. The process for re-building the Universe is explained simply in the following step.
  • New Universe (UNX) multi-source conversion:

A new Data Foundation shall be created, following the steps stated below:

  • Define connections
  • Create new Data Foundation
  • Copy and paste items to the new Data Foundation and/or re-type tables and joins using the standard SQL language.

Also the Business Layer needs changes, basically to be re-pointed to the new Data Foundation. The recommended steps are:

  • Re-point the Business layer to the new Data Foundation
  • The calls from the objects to the tables will need to be re-typed using the standard SQL language

A limitation in this stage is that the useful “View Associated Table” feature that showed the table lineage from a certain object has disappeared, so this might become quite a manual work. Opening the Universe Design tool in paral.lel with the Information Design tool to get the lineage might help here.

Once this is done, verify and export this new universe.

As a final step, the WebI reports can now be re-pointed to the new multi-source UNX so they can be enhanced with new alternative data.
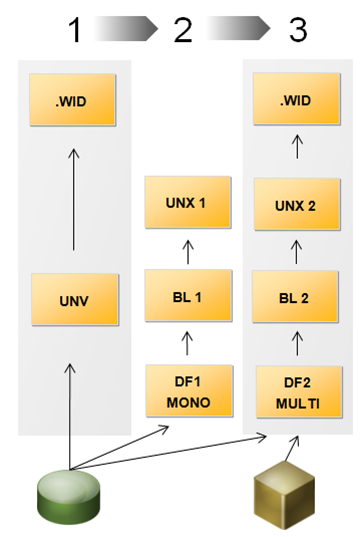
Process summary

See in the following diagram a summary of the process:

  • Step 1: Legacy Universe import
  • Step 2: New Universe UNX conversion
  • Step 3: New Universe UNX multi-source conversion

UNV to UNX conversion process summary

UNV to UNX conversion process summary

Conclusión

In the short term, in BI4 it should become a common practice to have 3 versions of the same universe:

  • UNV: To preserve the legacy WebI reports and to use certain client tools like Crystal 2011 or Live Office.
  • UNX mono-source: To use certain platform tools like Explorer or Crystal Enterprise and to have a higher level functionality.
  • UNX multi-source: To use certain platform tools like Explorer or Crystal Enterprise, have a higher level functionality and be able to use several sources in one Universe.

Mid-term only this last multi-source version should remain.

Beneficios

This Universe conversion method is time-efficient as it reuses all existing folders and objects, and shows tips for a better Universe re-creation.

The multi-source Universe gives superior benefits to the end user, providing a real-time integration and report design simplicity which will make their life easier. It also helps the meta-layer designers who will see their development time reduced with the help of the new design panel functionalities and a common standard language which is easier to understand. Project managers and architects can also consider the fact that they do not have to build a professional Data Warehouse for their projects, and with all this, IT managers will see a quick ROI and lower TCO for their investments.

If you have questions about this method or about the new Information Design Tool in SAP BI4, or if you want to share your experience or tips, please feel free to leave a comment!

Cómo desplegar aplicaciones web SAP BusinessObjects 3.1 con IBM Websphere

Como todos sabemos, Tomcat e IIS son las herramientas más utilizadas para implementar aplicaciones web (por ejemplo, InfoView, CMC, ..) en SAP BusinessObjects y que esta implementación puede realizarse automáticamente a través de la instalación del servidor de BusinessObjects. Sin embargo, SAP BO le permite realizar esto con otras aplicaciones. En este artículo hablaré sobre cómo podemos implementar aplicaciones web de SAP BusinessObjects utilizando IBM Websphere.

En primer lugar, debemos aceptar que cualquier implementación web, aparte de las realizadas con Tomcat e IIS, debe realizarse manualmente.

  • Aplicación admitida

SAP BusinessObjects 3.1 es compatible con IBM mediante el uso de Websphere 6 Express Edition o 6 ND Edition.

  • Instalación
    • Asegúrese de que IBM Wepsphere se haya instalado correctamente en la máquina y que todos los servicios estén en funcionamiento.
    • During the SAP BusinessObjects server installation, when you rich the web deployment part DO NOT SELECT any of the options to deploy Tomcat or IIS, just check the box to deploy the web application manually later.
  • Archivo de configuración web
    • El archivo de configuración de wdeploy es:

implementaciónconfig.websphere6.

    • Modify the config.websphere6 file (lines to be modified are in Bold).

archivo config.websphere6:

# as_dir: el directorio de instalación del servidor de aplicaciones

as_dir = C: Archivos de programaIBMWebSphereAppServer

# as_instance: la instancia del servidor de aplicaciones para implementar

as_instance = server1

# as_virtual_host: el host virtual al que estarán vinculadas las aplicaciones

as_virtual_host = default_host

# as_soap_port: el puerto de administración SOAP al servidor de administración.

# Si el valor no está configurado (si la línea está comentada), se utiliza el valor predeterminado.

as_soap_port = 8880

# as_admin_is_secure (predeterminado: falso): ¿se activa la seguridad en la web?

# La seguridad se activa cuando un usuario que desea iniciar sesión en el portal de administración tiene que proporcionar

# un nombre de usuario y una contraseña. Cuando la seguridad NO está activada, no es necesario

# proporcionar as_admin_username y as_admin_password (las líneas se pueden comentar)

as_admin_is_secure = false

as_admin_username = admin

# as_admin_password =% AS_ADMIN_PASSWORD%

# ws_instance: la instancia del servidor web que atenderá las solicitudes, en modo distribuido

# ws_instance = webserver1 (PARA USAR SI EL servidor web está instalado en modo SPLIT)

## No elimine la siguiente línea

enforce_file_limit = true


  • Comando usado para desplegar las aplicaciones

Para implementar la aplicación web, use la línea de comando (CMD) para escribir el comando en el servidor BO, el comando es:

"wdeploy config.websphere6 deployall"

Esto desplegará todas las aplicaciones web BO en el servidor IBM WebSphere, el proceso tomará aproximadamente 20 minutos para desplegar. Se instalan 17 aplicaciones.

  • Implementación de aplicaciones web con la consola de administración de websphere

Asegúrese de que su servidor de aplicaciones web WebSphere esté instalado, configurado y ejecutándose antes de desplegar archivos WAR.

  1. Inicie sesión en la consola "Administrativa de WebSphere Application Server" utilizando la siguiente URL: http://WAS_HOSTNAME:PORT/admin El número de puerto predeterminado de la consola de administración de WebSphere es 9060. Dé un nombre único para su aplicación web y continúe con el "Paso 2".
  2. Debajo del encabezado Aplicaciones del menú de navegación de la consola, haga clic en Aplicaciones empresariales en el panel de navegación izquierdo. Resalte el servidor que creó (o resalte servidor1 si no creó el suyo propio) desde los Clústeres y servidores y active la "casilla de verificación Seleccionar". Continúe con el "Paso 3"
  3. Haga clic en el botón Instalar y navegue hasta la ubicación del archivo WAR para implementar. Si realiza la implementación desde un sistema de archivos remoto, seleccione la opción "Sistema de archivos remoto". Seleccione el host virtual que creó (o default_host si no creó el suyo) de la lista desplegable de Virtual Host. Continúe con el "Paso 4".
  4. Ingrese una raíz de contexto para el archivo WAR (por ejemplo, / CmcApp para CmcApp.war) y presione el botón Siguiente, seguido de Continuar.
  5.  Revise la página de resumen y presione Finalizar cuando haya terminado.
  6. Haga clic en Guardar en configuración maestra.
  7. Haga clic en el enlace Guardar, luego en el botón Guardar.
  8. Debajo del encabezado Aplicaciones del menú de navegación de la consola, haga clic en Aplicaciones empresariales en el panel de navegación izquierdo.
  9. Verifique que el archivo WAR se haya implementado y luego haga clic en el botón Inicio. Repita los pasos 1-11 para cada archivo WAR a implementar.
  • Prueba

Para probar su implementación, simplemente abra el navegador y escriba la URL (EX. InfoView):

http://”BOservername”:”PortNumber”/InfoViewApp


Si tiene alguna pregunta o contribución, deje un comentario a continuación.

Asistir al Webinar de Clariba "¿Por qué migrar a SAP BusinessObjects BI 4?"

Do you wish to know more about the reasons to migrate to SAP BusinessObjects BI 4, the most advanced Business Intelligence platform?

Attend our Webinar on the 12th of April, from 11:00-12:00 CET (Presented in Spanish)

REGISTRAR AQUÍ

SAP BusinessObjects BI 4 offers a complete set of functionalities that are key to today´s Business Intelligence market: an improved performance management, reports, search, analysis, data exploration and integration. This new version of SAP´s BI platform introduces several significant improvements to your BI environment, with a great number of functionalities designed to optimize performance.

With this in mind, Clariba invites you to invest an hour of your time to get to know the news and advantages of SAP BusinessObjects BI4, the most advanced BI platform.

The agenda of our webinar is the following:

  • Bienvenida e introducción
  • Qué hay de nuevo en SAP BusinessObjects BI 4
  • Beneficios de migrar a SAP BusinessObjects BI 4
  • ¿Por qué migrar con Clariba?
  • Preguntas y respuestas

For more information about SAP BusinessObjects BI 4, Visita nuestro sitio web.

Atentamente,

Lorena Laborda Business Development Manager - Clariba


Asista al Webinar ¿Porqué migrar a SAP BusinessObjects BI 4?


¿Desea conocer más acerca de los motivos para migrar un negocio sap bi-0, la plataforma más avanzada de inteligencia empresarial?

Asista a nuestro Webinar el 12 de Abril de 11.00 a 12:00 (CET)

REGÍSTRESE AQUÍ


SAP BusinessObjects BI 4 es la primera y única plataforma de Business Intelligence (BI) que proporciona un completo abanico de funcionalidades claves en el actual mercado de BI: una mejor gestión del rendimiento, informes, consultas y análisis, exploración de datos e integración. Esta nueva versión de la plataforma de SAP introduce avances significativos en su entorno de BI,  con un gran número de prestaciones diseñadas para optimizar su rendimiento.

Con esto en mente, Clariba le invita a invertir una hora de su tiempo para conocer las novedades y ventajas de SAP BusinessObjects BI4, la plataforma más avanzada en el mercado de Business Intelligence.

La agenda para el webinar ¿Porqué migrar a SAP BusinessObjects BI 4? es la siguiente:

  • Introducción y bienvenida
  • Novedades en sap businessobjects bi 4
  • Ventajas de migrar a sap businessobjects bi 4
  • Porque migrar con clariba
  • Preguntas y respuestas

Para obtener más información acerca SAP BusinessObjects BI 4, visite nuestro sitio web. Saludos cordiales,

Lorena Laborda Business Development Manager - Clariba

Applying Custom Security on Web Intelligence Documents

Uno de los principales obstáculos que debe superar un desarrollador de Web Intelligence es cómo lidiar con la seguridad de los datos. De hecho, la búsqueda de seguridad de datos sigue siendo la principal preocupación para muchas empresas que intentan garantizar la disponibilidad, integridad y confidencialidad de la información comercial, protegiendo tanto la base de datos de las fuerzas destructivas como las acciones no deseadas o la visualización de datos no deseados de usuarios no autorizados.En SAP BusinessObjects tenemos varias formas de configurar una hoja de ruta de seguridad en términos de acceso a datos de autorización, pero esta vez me gustaría hablar sobre cómo usar la seguridad personalizada en nuestros documentos WebI mediante una tabla simple, uniones forzadas en el Diseñador de universos y la herramienta WebI para mostrar solo los datos que un usuario está autorizado a ver.

Tenemos el siguiente escenario: Imagine que tenemos un grupo con diferentes niveles de jerarquía en términos de niveles de acceso a datos. Cuanto más alto se encuentre en la organización, más datos tendrá acceso. De esta manera, el primer nivel dentro de la jerarquía puede ver todos los datos, el segundo nivel en la jerarquía puede ver sus datos de nivel y los niveles a continuación, pero no tendrá acceso a la información del primer nivel, el tercer nivel puede ver sus propios datos y niveles a continuación , pero no tendrá acceso a información de segundo y primer nivel ... y así sucesivamente.


Veamos ahora un enfoque paso a paso sobre cómo lograr esto

Lo primero que debe hacer es un ejercicio para definir cuál es la estructura de la jerarquía, especificando el nivel de cada individuo y la fecha a la que tendrá acceso. Después de eso, tenemos que crear una tabla en nuestra base de datos donde almacenaremos grupos, usuarios y privilegios. Los campos clave para este propósito son:

BO_User: Esto se verificará con los usuarios actuales que tienen acceso a la webi.

Nivel más alto: Nivel en la jerarquía a la que pertenece el usuario. Para este ejemplo tendremos 4 niveles de organización donde 0 es el nivel más alto y 3 es el más bajo.

Level_value: se verificará en la tabla de hechos.

Una vez que tengamos la tabla con todos los datos relacionados ya almacenados, es hora de asignarla en la metacapa de SAP BusinessObjects. Para este propósito, tenemos que importar el universo afectado y crear una tabla derivada que recupere todos los datos relacionados para un usuario determinado (esto significa todos los datos que un usuario puede ver de acuerdo con su nivel de acceso a datos). El código SQL debería ser similar al siguiente:

SEL       BO_User, Level_Organization_3 FROM  CLARIBA.SECURITY a

IZQUIERDA UNIRSE

(SEL Level_Organization_0 , Level_Organization_1 , Level_Organization_2 , Level_Organization_3 FROM CLARIBA.FACT_TABLE GROUP BY 1,2,3,4) b

ON (

(Highest_Level=0 AND UPPER (a.level_value) = b.Level_Organization_0) O (Highest_Level=1 AND UPPER (a.level_value) = b.Level_Organization_1) O (Highest_Level=2 AND UPPER (a.level_value) = b.Level_Organization_2) O (Highest_Level=3 AND UPPER (a.level_value) = b.Level_Organization_3) )

Dónde security_group=' CLARIBA'


Esta tabla derivada en particular creará un par de objetos que se usarán en la WebI que queremos proteger (BO_User y Level_Organization_3).

El tercer paso es desarrollar y aplicar la seguridad en la WebI donde queremos llevar a cabo la restricción de datos. Para este propósito tenemos que crear dos nuevas dimensiones y un detalle. Asegúrese de que su consulta incluya esos objetos recién creados.

First task is discovering which users are trying to access the WebI. We can get their login by creating a new dimension named “BO_User” that contains the following formula:

 = CurrentUser ()


Once we know who is trying to access WebI, we have to control if the BO_User matches with the User name that we had in our table.  We can create a dimension named “FlagBOuser” with the following formula:

= If (Inferior ([BO_User]) = Inferior ([Nombre de usuario]); 1; 0)


Next step is to control what level of data access this BO_user will have. In other words we are applying a kind of row/column level security. For this purpose we create a detail object named “Level_Organization” with the following code:

= If ([FlagBOUser] = 1; [Level_Organization_3])


Una vez que tenemos estos objetos de información, el último paso es arrastrar y soltar tanto FlagBOuser como Level_Organization como filtros globales a nivel de documento. De esta forma, aplicamos la restricción de datos a cada bloque de datos que se muestra en el informe.

Las condiciones que se aplicarán son simples: "FlagBOuser" debe ser igual a 1, lo que significa que un usuario determinado que tenemos corresponde a un usuario en la tabla de la base de datos y "Level Organization" no es nulo, lo que significa que tenemos datos para mostrar .

En este punto del ejercicio, deberíamos poder restringir el contenido de los datos que se muestran en la WebI de acuerdo con un usuario determinado que quiera acceder a él.

Por último, pero no menos importante, también podemos controlar algunas celdas particulares, como la información de subtotales, creando una bandera que garantice que solo los empleados que tienen permiso puedan ver este contenido.

= If (Lower ([BOUser]) InList ("SilviaR"; "JoseY”); 1; 0)


Como hemos visto en este ejemplo, esta seguridad personalizada en WebI proporciona una alternativa a otros tipos de seguridad que podemos aplicar en nuestro sistema BO (como la seguridad de fila / nivel en Universe Designer). Podemos lograr una solución de seguridad de datos bastante agradable con simplicidad, efectividad y requisitos de mantenimiento reducidos.

Si tiene alguna pregunta, no dude en dejar un comentario a continuación.

Implementing Materialized Views in Oracle - Execute queries faster

Let's assume that you've been convinced by Marc's excellent article about the aggregate awareness dilemma, and that after balancing all the arguments you've decided to implement the aggregates in your Oracle database. Two parts are necessary: the materialized views and the query rewrite mechanism.

What is a materialized view?

Think of it as a standard view: it's also based on a SELECT query. But while views are purely logical structures, materialized views are physically created, like tables. And like tables, you can create indexes on them. But the materialized views can be refreshed (automatically or manually, we'll see that later) against their definitions.

Let's imagine the following situation: a multinational company manages the financial accounts of its subsidiaries. For each period (year + month) and for each company, many thousands of records are saved in the data warehouse (with an account code and a MTD (month to date) value). You'll find below a very simplified schema of this data warehouse.

What happens when we want to have the sum of all accounts for each period?

Without a materialized view, all the rows have to be retrieved so that the sum can be calculated. In my case, the following query takes around 2 seconds on my test database. The explanation plan tells me that more than 1 million records had to be read in the first place.

(Query 1)

select p.year, p.month, sum(a.mtd)

from dim_period p

join account_balance a on a.period_key = p.period_key

group by p.year, p.month

So how do you avoid this reading of more than 1 million records? A solution is to maintain aggregate tables in your database. But it means a bigger ETL and a more complex Universe with @aggregate_aware functions. Although this could be a valid option, we've chosen to avoid that..

Another solution is to create a materialized view. The syntax can be quite simple:

(Query MV-1)

CREATE MATERIALIZED VIEW MV_PERIODS

BUILD IMMEDIATE

ENABLE QUERY REWRITE

COMO

select p.year, p.month, sum(a.mtd)

from dim_period p

join account_balance a on a.period_key = p.period_key

group by p.year, p.month

Let's go through the query lines.

  • CREATE MATERIALIZED VIEW MV_PERIODS => We simply create the view and give it the name MV_PERIODS.
  • BUILD IMMEDIATE => The materialized view will be built now
  • ENABLE QUERY REWRITE => If we don't specify this, then the materialized view will be created and could be accessed directly, but it wouldn't be automatically used by the query rewriting mechanism.
  • The "as select…" is the same as the original query we made.

You'll notice when executing this query that the time needed to create this materialized view is at least the time needed to execute the sub-query (+ some time needed to physically write the rows in the database). In my case it was 2.5 seconds, slightly more than the original 2 seconds.

If now I re-execute my original query, I get the same result set as before, but instead of 2 seconds I now need 16 milliseconds. So it's now 120 times faster! Oracle understood it could automatically retrieve the results from the materialized view. So it only read this table instead of doing of full read of the fact table.


The data freshness

Now imagine a new month is gone, and new rows have arrived in your data warehouse. You re-execute your original select query and at your great surprise, it takes a lot of time: 2 seconds! But why?

It is possible to ask Oracle to tell us if a query was rewritten with a given materialized view, and if not to give us the reasons. Let's see a possible syntax below.

SET SERVEROUTPUT ON;

DECLARE

Rewrite_Array SYS.RewriteArrayType := SYS.RewriteArrayType();

querytxt VARCHAR2(4000) := '

select p.year, p.month, sum(a.mtd)

from dim_period p, account_balance a

where a.period_key = p.period_key

group by p.year, p.month

';

no_of_msgs NUMBER;

i NUMBER;

Comenzar

dbms_mview.Explain_Rewrite(querytxt, 'MV_PERIODS',  Rewrite_Array);

no_of_msgs := rewrite_array.count;

FOR i IN 1..no_of_msgs

LAZO

DBMS_OUTPUT.PUT_LINE('>> MV_NAME  : ' || Rewrite_Array(i).mv_name);

DBMS_OUTPUT.PUT_LINE('>> MESSAGE  : ' || Rewrite_Array(i).message);

END LOOP;

END;

(The sections in red indicate which parts of the query you can update; the rest should stay as is).

Once I executed these lines, I got the following result:

>> MV_NAME  : MV_PERIODS

>> MESSAGE  : QSM-01150: query did not rewrite

>> MV_NAME  : MV_PERIODS

>> MESSAGE  : QSM-01029: materialized view, MV_PERIODS, is stale in ENFORCED integrity mode

(Technical note: to see these lines in the Oracle SQL Developer, you need to activate the DBMS output: menu View / DBMS Output and then click on the button 'Enable DMBS Output for the connection)

The line "materialized view, MV_PERIODS, is stale in ENFORCED integrity mode" means that the materialized view is not used because it does not have the right data anymore. So to be able to use the query rewrite process once again, we need to refresh the view with the following syntax:

BEGIN DBMS_SNAPSHOT.REFRESH('MV_PERIODS','C'); end;

Note that in certain situations, the final users may prefer having the data from yesterday in 1 second rather than the data of today in 5 minutes. In that case, choose the STALE_TOLERATED integrity mode (rather than the ENFORCED default) and the query will be rewritten even if the data in the materialized view is not fresh anymore.


Extend your materialized views

Now let's imagine that we want to have not only the account sums by periods, but also by company code. Our new SQL query is the following:

(Query 2)

select p.year, p.month, c.company_code, sum(a.mtd)

from dim_period p, account_balance a, dim_company c

where a.period_key = p.period_key

and a.company_key = c.company_key

group by p.year, p.month, c.company_code

Of course the materialized view MV_PERIODS doesn't have the necessary information (company key or company code) and cannot be used to rewrite this query. So let's create another materialized view.

(Query MV-3)

CREATE MATERIALIZED VIEW MV_PERIODS_COMPANIES

BUILD IMMEDIATE

ENABLE QUERY REWRITE

COMO

select p.year, p.month, c.company_code, sum(a.mtd)

from dim_period p, account_balance a, dim_company c

where a.period_key = p.period_key

and a.company_key = c.company_key

group by p.year, p.month, c.company_code

So now our query takes a very short time to complete. But what if, after having deleted the MV_PERIODS materialized view, you try to execute the first query (the one without the companies)? The query rewrite mechanism will work as well! Oracle will understand that it can use the content of MV_PERIOD_COMPANIES to calculate the sums quicker.

Be aware that the query will only rewrite if you had created a foreign key relationship between ACCOUNT_BALANCE.COMPANY_KEY and DIM_COMPANY.COMPANY_KEY. Otherwise you'll get the following message:

QSM-01284: materialized view MV_PERIODS_COMPANIES has an anchor table DIM_COMPANY not found in query.


Is basing the materialized view on the keys an option?

The materialized views we've created are very interesting but still a bit static. You may ask yourself: wouldn't have it been a better idea to base the materialized view on the keys? For example with the following syntax:

(Query MV-4)

CREATE MATERIALIZED VIEW MV_PERIODS_COMPANIES_keys

BUILD IMMEDIATE

ENABLE QUERY REWRITE

COMO

select period_key, company_key, sum(mtd)

from account_balance

group by period_key, company_key

The answer is "it depends". On the good side, this allows for a greater flexibility, as you're not limited to some fields only (as in the query MV-1 where you're limited to year and month). On the bad side, as you're not using any join, the joins will have to be made during the run-time, which has an impact on the performance query (but even then, the query time will be much better than without materialized views).

So if you want a flexible solution because you don't know yet which are the fields that the users will need, it's probably better to use the keys. But if you already know the precise queries which will come (for example for pre-defined reports), it may be worth using the needed fields in the definition of the materialized view rather than the keys.

If you have any doubts or further information on this topic, please leave a comment below.

Asistir al Webinar de Clariba "¿Por qué migrar a SAP BusinessObjects BI 4?"

¿Desea saber más sobre las razones por las cuales migrar a SAP BusinessObjects BI 4, la plataforma de inteligencia empresarial más avanzada?

Asista a nuestro seminario web el 13 de marzo, del 11:00 - 12:00 CET (Presentado en español)

REGISTRAR AQUÍ

SAP BusinessObjects BI 4 ofrece un conjunto completo de funcionalidades que son clave para el mercado actual de Business Intelligence: una gestión mejorada del rendimiento, informes, búsqueda, análisis, exploración e integración de datos. Esta nueva versión de la plataforma de BI de SAP introduce varias mejoras significativas en su entorno de BI.

Con esto en mente, Clariba lo invita a invertir una hora de su tiempo para conocer las novedades y ventajas de SAP BusinessObjects BI4, la solución de BI más avanzada le brindará a su empresa una gran cantidad de funcionalidades diseñadas para optimizar el rendimiento y brindarle Una plataforma escalable y segura.

The agenda of our webinar is the following:

  • Bienvenida e introducción
  • Qué hay de nuevo en SAP BusinessObjects BI 4
  • Beneficios de migrar a SAP BusinessObjects BI 4
  • ¿Por qué migrar con Clariba?
  • Preguntas y respuestas

For more information about SAP BusinessObjects BI 4, visit our website www.clariba.com

Atentamente,

Lorena Laborda Business Development Manager - Clariba


Atienda al Webinar ¿Por qué migrar a SAP BusinessObjects BI 4?


¿Desea conocer más acerca de los motivos para migrar un negocio sap bi-0, la plataforma más avanzada de inteligencia empresarial?

Asista a nuestro Webinar el 13 de Marzo de 11.00 a 12:00 (CET)

REGISTRO AQUÍ


SAP BusinessObjects BI 4 es la primera y única plataforma de Business Intelligence (BI) que proporciona un completo abanico de funcionalidades claves en el mercado actual de BI: una mejor gestión del rendimiento, informes, consultas y análisis, exploración de datos e integración . Esta nueva versión de la plataforma de SAP introduce avances significativos en su entorno de BI.

Con esto en mente, Clariba le invita a invertir una hora de su tiempo para conocer las novedades y ventajas de SAP BusinessObjects BI4, la más avanzada plataforma en el mercado de Business Intelligence, hacer que su compañía se beneficie de un gran número de prestaciones de inversión para optimizar su rendimiento, ofrecer una plataforma escalable y 100% segura.

La agenda para el webinar ¿Porqué migrar a SAP BusinessObjects BI 4? es la siguiente:

  • Introducción y bienvenida
  • Novedades en sap businessobjects bi 4
  • Ventajas de migrar a sap businessobjects bi 4
  • Porque migrar con clariba
  • Preguntas y respuestas

Para obtener más información acerca SAP BusinessObjects BI 4, visite nuestro sitio web www.clariba.com Saludos cordiales,

Lorena Laborda Business Development Manager - Clariba

Adjunte una captura de pantalla del panel de control a un correo electrónico con un "clic"

Es impresionante hasta dónde podemos llegar durante un proyecto si tratamos de cumplir con todos los requisitos de nuestros clientes, incluidos aquellos que parecen algo complicados de resolver. Durante uno de nuestros proyectos en Oriente Medio, recibimos una de esas solicitudes. Nuestro cliente nos pedía que creáramos una funcionalidad para enviar capturas de pantalla de su tablero por correo electrónico. Lo suficientemente justo.

Inmediatamente pensamos en instalar alguna herramienta gratuita para creadores de PDF y decirles que imprimieran en pdf y luego adjuntasen el documento al correo electrónico, pero hubo demasiados pasos de acuerdo con nuestro cliente. Necesitábamos lograr esta funcionalidad con un solo "clic".

En un par de horas y algunos correos electrónicos enviados a mis colegas Pierre-Emmanuel Larrouturou y Lluis Aspachs, estábamos trabajando en una solución destinada a trabajar con software de código abierto y herramientas gratuitas que encontramos en Google.

A continuación se detallan los pasos que seguimos para lograr el objetivo:

Creamos el archivo exe que hace la instantánea y lo adjuntamos a un correo electrónico

  • Busca las carpetas C: / Temp o D: / Temp para guardar la imagen.
  • Busca Outlook (Office 2003, 2007 o 2010) tanto en C: / como en D: / Drive
  • Agregamos Xcelsius_burst.bat para omitir las ventanas y autorizar el lanzamiento del exe
  • Guardamos los dos archivos dentro de C: / Drive pero también se puede agregar a D :. si el usuario crea una carpeta dedicada, solo se debe editar el archivo .bat
  • Agregamos la ruta del archivo bat a un botón de URL en Xcelsius y lo ejecutamos

Notas: compruebe las opciones de su navegador para evitar las ventanas emergentes de murciélagos si son un problema. Esta versión solo funciona si está instalada en cada máquina del cliente. Si desea instalarlo en un servidor (para evitar las múltiples instalaciones), puede crear una solución más compleja utilizando los Pstools disponibles de forma gratuita en la red y agregándolos a su servidor web (en nuestro caso, era Tomcat).


Puede descargar los archivos haciendo clic en el siguiente enlace. Esta solución es bastante simple, pero hizo que nuestro cliente estuviera muy contento.

Explosión del tablero de instrumentos


Solo para agregar más valor al artículo, hay otra forma de resolver este problema: también estamos agregando a continuación la última versión de la función Dashboard_by_email.exe, que permite que cualquier captura de pantalla (no solo de Dashboards) se adjunte automáticamente a los correos electrónicos. El programa debe ejecutarse al inicio de Windows y el usuario puede obtener la captura de pantalla directamente adjunta a su correo electrónico presionando CTRL + ALT + D. Haga clic en el enlace de abajo para descargar.

Panel de control por correo electrónico


We are also aware that the market is now offering add-ons for Dashboard Design which can also meet this and other requirements. You can check out what our friends at Data Savvy Tools (http://datasavvytools.com/) created for dashboard printing. We have tested their component that allows the selection of dashboard components to be printed out (and it´s great).

Háganos saber sus comentarios y estaremos más que felices de discutir estas soluciones con usted.


SAP Universe Designer Tricks and Tips: Table Mapping

You know everything there possibly is to know about SAP Universe Designer right? Well, I bet that there´s still a trick or two you can discover. For example, there is one function not frequently used in Universe Designer called Table Mapping. This option was originally included in Universe Designer to protect some data to be seen by Developers (the developers´ user group sees the data from a different table than the Business users).

In this article we are going to show how to implement this table mapping feature for the use that it was meant for and we will then apply it in a couple of real life scenarios to provide developers with a simple and effective solution that minimizes the maintenance on their systems.

In order to create a replacement rule, follow the steps below

1. Go to Tools – Manage Security – Manage Access Restriction.

Foto 1
Foto 1

2. Click New to create the new restriction

Picture2
Picture2

3. Go to Table Mapping and click Add to create the new rule

Picture3
Picture3

4. Fill in the tables you want to replace. In this case, we want the developers to see the data from the table SALES_FACT of the schema DEV_DB instead of PROD_DB (where we are storing the production data).

Imagen4
Imagen4

5. Click ok, fill in the name for the rule (In this case Developers Sales) and click ok

Picture5
Picture5

6. To apply this rule only to the user group “Developers”, click on “Add user and group”

Picture6
Picture6

7. Select the group IT, and click Ok

Picture7
Picture7

8. Apply the rule to the IT group

Picture8
Picture8

Once we have published the universe, all the reports will change the SQL code automatically between the tables DEV_DB.SALES_FACT and PROD_DB.SALES_FACT depending on the user that is logged into the system.

One important point to take into consideration is the priority of the rules: In case of conflict, the restriction with the highest priority – lowest priority index –  lowest priority number will apply.

The example we reviewed above (dynamic change between developers and business user tables) is the most typical use for this functionality. However, there are some other scenarios where the table replacement could be very useful:

Scenario 1: We are reloading data on a production table. Previously, we have created a copy of the old data in a temporary table that we want to use for reporting while the reloading has not finished.

Solution: We can add a new rule to replace the original table for the temporary one, and apply it to the group “Everyone”. As soon as the reload is completed we can delete the rule. This process is much faster than renaming the table on the universe and to change all the objects that the universe is using on this table.

Scenario 2: We have different fact tables for different departments with the same or similar table structure and  all the dimension tables are common. We are looking for the best solution that reduces future maintenance.

Solution: Instead of creating different copies of the same universe by changing the fact table, we can create one universe and use the table replacement functionality to dynamically switch the fact table depending on the user functional group (in this case would be the department) that the user belongs to.

As we have seen in these examples this table mapping feature provides the developers with simplicity, effectiveness and maintenance reduction on their systems.

Si tiene alguna pregunta, no dude en dejar un comentario a continuación.

Xcelsius in BI on Demand (BIOD)

In this blog article I am going to talk about Xcelsius in SAP BI On Demand (BIOD). What I am going to explain are the steps that you should follow to upload an existing Xcelsius Dashboard to the BIOD system. 

What is BIOD?

First of all, for those who don’t know what is BIOD I will give a brief explanation. Basically we can say that BIOD is the most complete and approachable cloud based business intelligence suite available in the market today. BIOD is software as a service; you do not need to install any software on your machines to get instant value from the system. All you need to do is Log in and provide some data. It is a cheap BI solution, due to the fact that you don’t need to make a huge investment in hardware, licenses, etc... everything is in the net.  The target for this technology is small companies, which are less likely to be able to acquire a BI system due to the costs, but with BIOD they have an accesible  way into SAP BusinessObjects analysis system. In BIOD you are able to create:

  • Xcelisus Dashboards
  • Web Intelligente reports
  • Explorador

You can get more information about BI On Demand here.

 Now, let´s see how to upload an existing XCelsius Dashboard to the BIOD system.

How to upload an Xcelsius Dashboard to BIOD?

First of all, if you don’t have a BIOD account you should create it. It s free, and with it you will able to test most of the features of this cloud system. Click here to Sign up.

Once we are logged, we will see this screen.

Now I want to show you how you should upload an existing Xcelsius file with static data to the BIOD system.

First of all we should create the DataSource, so in my Stuff panel we should select Datasets. After that we click Add New Button  -> Add Dataset

Then we should chose from which place we will select the dataset. We have several options: Create From Query (this option is only available in the BIOD Advanced version, where the connection to a universe is possible), bring data from salesforce or create an empty dataset from scratch and finally, we can upload a file (xls,xlsx or csv) which we will use in this example.

As I said before, we select an excel file as source of our dataset, in the first row of our excel file it is important to have the labels of each column. We can also edit this dataset, change the value type of each column, the label name, etc...

At the bottom of this page we can find the properties section, here we should enable the Web service. Once we have done this, the system will generate a url that will be the reference to the dataset in our dashboard.

The next step will be to upload the Xcelsius file as a template, so we select Add New -> Add Template.

We create a name for this template, uncheck the Create a new Xcelsius file check box and finally, select the xlf file that we have locally.

The screen below will then appear. In order to connect the dataset to our xlf file we should select the blue sentence (you may click here to edit the Xcelsius file). You can also attach an image of the dashboard as a thumbail for repository. The object selection will be fancier.

Once the Xcelsius editor is opened we add a connection using OnDemand -> Add Connection menu option. This will create one Flash Variables connection ([Flashvar]) and two Web Service Connections ([OD_Data1 and OD_Data2). In our case we should delete one data connection because we only have one source, but in case we need more data sources we can create as many as we want. It will also create a new tab in the XC spreadsheet that contains these cell bindings.

After that we configure the data connections. Open the Data Manager (Data -> Connections) and you will see a Connection of type FlashVars.  You should see the following:

  • get_data_url: (mandatory). This should be bound to the cell which the Web Service Url of the Web Service Connections are also bound to. If you have multiple connections this should be bound to the range which holds those connections.

Then each Web Service Connection (OD_DataN), in our case only OD_Data1 points to the set of cells to which that connection outputs its data.

These are the next steps that you should follow in order to setup the dashboard:

  • Click on My Datasets and click copy beside the dataset OD_Data1.
  • Paste the url from dataset to the WSDL URL input box of a Web Service connection

  • Click Import to import the schema.
  • Bind the web service url to the same cell as get data url (Note: if you used the Add Connection process this should already be done).
  • Bind the headers and the row values.
  • Set Refresh on Load to be true.

After these steps you can save your changes and then click the Back button to go back to Edit Connection step of creating a template. You should see your connection listed on the screen.

Click Next to go to the Edit Sample Data step, you can choose to add in your sample data from the XLF if you like, and then click Finish.

Finally we will create a visualization using this template. We select our Data Input, in this case Data Source.


If we go to the visualization menu we can find the object.


In conclusion we can say that the BIOD system is a nice tool to start testing the power of the SAP solutions without a potential heavy investment at the beginning. It can be also a good tool to make demos on and show our dashboards to customers. It is very interesting to test the explorer tool, you can see the amount of options that the BIOD brings you in terms of data analysis.  If you are interested in the advanced solution you should get in touch with SAP.

If you have any comment or doubts do not hesitate to contact us or leave a comment below.

Abordar el dilema de la conciencia agregada

In my last project I faced a situation where the customer asked me about the best option for a particular topic and this time my answer had to be "it depends". As a consultant, my duty was to provide two different options (with their corresponding pros and cons) but I could not make a decision on this, since the answer was highly dependent on the composition of IT service providers in different areas and also their road map. In general BI terms, we could define aggregation as the process of summarizing information at a certain level of detail in order to improve the performance. The Kimball Group defines Aggregate Navigation as the ability to use the right aggregated information and recommends to design an architecture with services that hide this complexity from the end user. In the BusinessObjects world the same concept is called Aggregate Awareness and the database administrators community usually refers to it as query re-write.

En SAP BusinessObjects, esto se puede lograr mediante el uso de la función @aggregate_aware, contextos y objetos incompatibles en el diseñador de universo. En un nivel de base de datos (RDBMS), ciertos proveedores proporcionan esta característica a través de vistas materializadas con opción de reescritura de consulta (Oracle, Sybase, DB2, Informix, PostgreSQL y algunos otros).

Así que aquí tenemos el dilema: ¿dónde colocar esta lógica en un entorno de cliente: en la capa física o en la capa lógica?

Ambas opciones son válidas, pero hay algunas consideraciones que deben tenerse en cuenta desde diferentes puntos de vista:

Comparación de tablas

La información que se ve en la tabla anterior ya puede ser interpretada, pero como resumen, mi recomendación sería:

Implementación de la conciencia agregada en SAP Business Objects:

  • Ideal para una arquitectura con muchas fuentes de base de datos (no todas las fuentes de base de datos admiten la característica de reescritura de la consulta y debe mantenerse en cada una de ellas)
  • Es bueno tener si el proveedor de la base de datos puede ser cambiado en el futuro (no hay cambios necesarios en el universo)
  • No hay acceso a administradores de base de datos que puedan ajustar correctamente la base de datos
  • Arquitectura de informes cerrada basada en una capa semántica fuerte en Business Objects
  • Existe la necesidad de un repositorio centralizado de metadatos

Implementación de mecanismos de reescritura de consultas en el RDBMS:

  • Ideal para una arquitectura con muchas herramientas de informes que acceden a la misma base de datos
  • Acceso a administradores de bases de datos sólidos
  • Simplifica el diseño del universo
  • No es necesario un repositorio centralizado de datos

If after reading this post you still have doubts on what direction to go for at your company or customer, do not hesitate to contact clariba at info@clariba.com or leave a comment below.

EspañolEnglish