In this article, we’ll walk you through the process of creating virtual data models in SAP Data Warehouse Cloud to make your data easily available to business users.
In the series so far we have covered various topics such as space management, setting up your connections, building integration processes with Data Flows, and preparing your data. In this piece, we will explain the foundation of Data Modeling concepts and how these principles are applied in the SAP Data Warehouse Cloud.
¿Qué es el modelado de datos?
Data Modeling is the key to how we get and store our data and provide actionable insights to business users in SAP Data Warehouse Cloud. Depending on the data modeling techniques you use adaptability and performance can vary greatly.
The definition of a data model is the way you structure all your data specifying the different relationships between all of the elements. This structure must align with your business needs in terms of query performance and the ability to create analytics on top, as well as making it scalable and easy to maintain.
Antes de comenzar con su modelo de datos, debe identificar cuáles son las preguntas comerciales que está tratando de responder y enumerar todos los elementos relacionados con ellas.
1. Hechos, medidas y dimensiones
As mentioned before, the data model will contain facts, measures, and dimensions. A fact is the part of your data that indicates a specific occurrence or transaction, like the sale of a product or receiving a shipment of a certain number of items from a supplier. Note that a fact is composed of multiple measures, these can be qualitative, like a Product SKU, or quantitative, like the price of a product. The qualitative measures can be then linked to specific characteristics of that measure, which are called dimensions.
Dimensions are pieces of data that allow you to understand and index measures in your data models. Dimensions are either characteristics of a measure or pieces of data that help contextualize the fact.
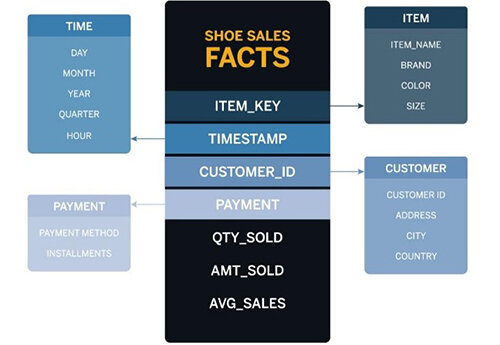
The separation between facts and dimensions has an impact on your data models and how their graphical representation looks. For example, a simple star schema of Best Run Shoes would look something like this:
2. Tipos de Modelos
In SAP Data Warehouse Cloud, you can build logical and physical data models:
Logical data models allow you to determine and connect specific attributes of data. For example, this is where you would make sure the data about your customer is complete with full name, street name, city, country, and ZIP code, among other data points about each customer.
Physical data models determine how the data is physically stored, for example, in which drive it is stored.
Data Models can be simple or complex depending on your business needs. SAP Data Warehouse Cloud provides you with the flexibility to choose between SQL queries or graphical views.
3. Diagrama entidad-relación
This is the first step to start data modeling, here you will define all elements and entities and define the relationship between all of them. This is what we call an Entity Relationship Diagram (ERD). For example, Product, Supplier, Address, etc…
The basics elements in an ERD are entities, attributes, and relationshipsLos elementos básicos de un ERD son entidades, atributos y relaciones.
4. Data Builder
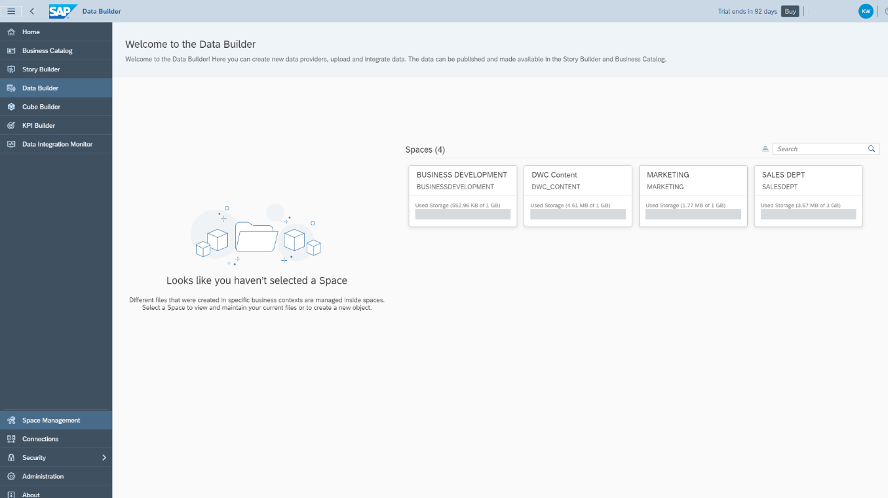
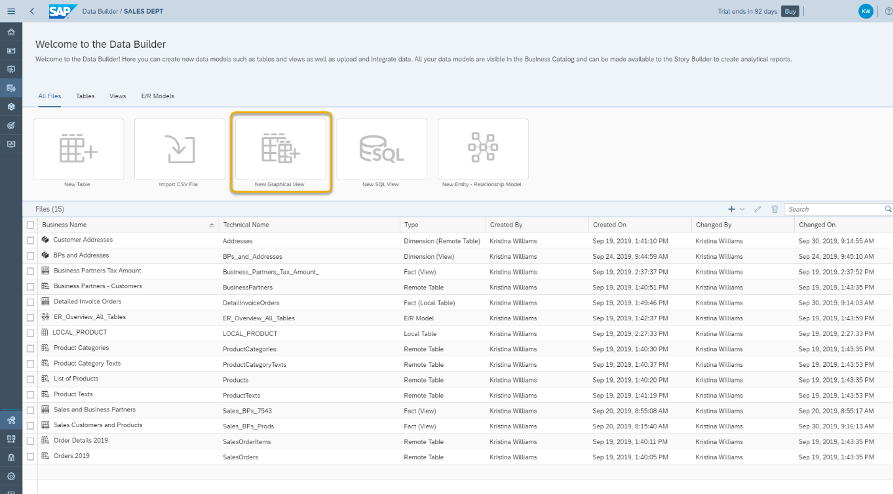
In SAP Data Warehouse Cloud, start with the Data Builder and select the Space in which you want to model your data.
Then, click on New Graphical View.
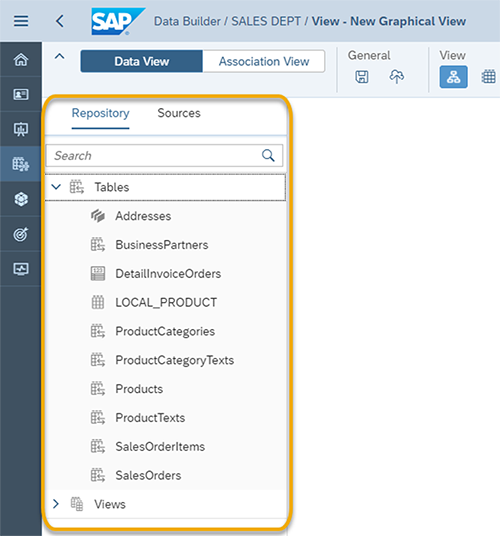
The next step is to use the left side panel to select your data sources. You can either use the data already in the Repository of this Space or select from the Sources connected to this Space.
4.1 Inicie el modelado
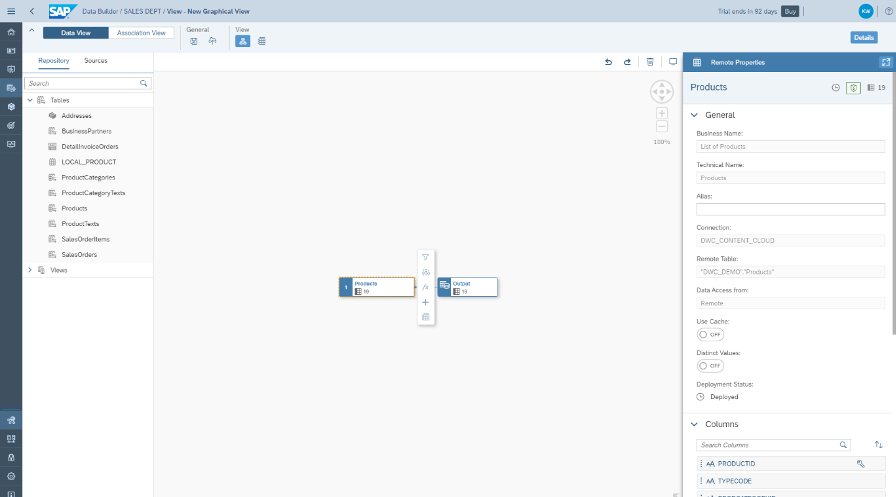
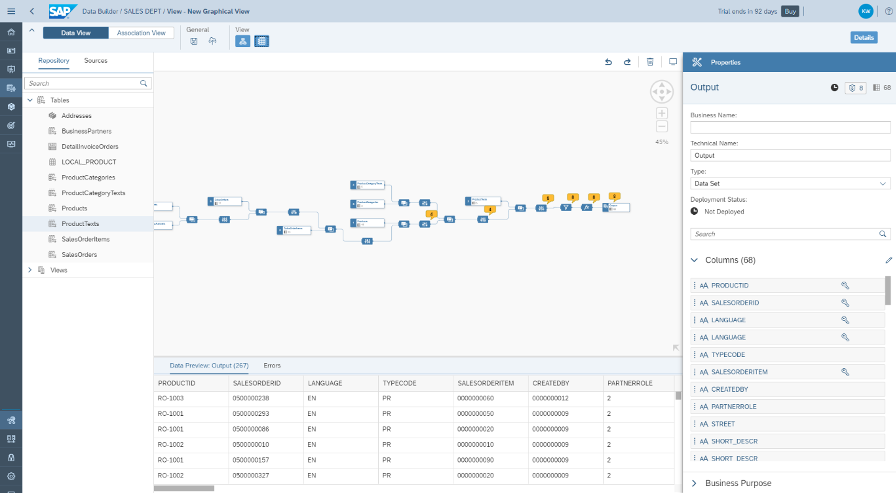
To start modeling your data, select a table or view, click on it, and drag it to the canvas in the middle of the screen. Once you drop it on the canvas, an Output node will be automatically created and linked to the table or view you dragged to the canvas.
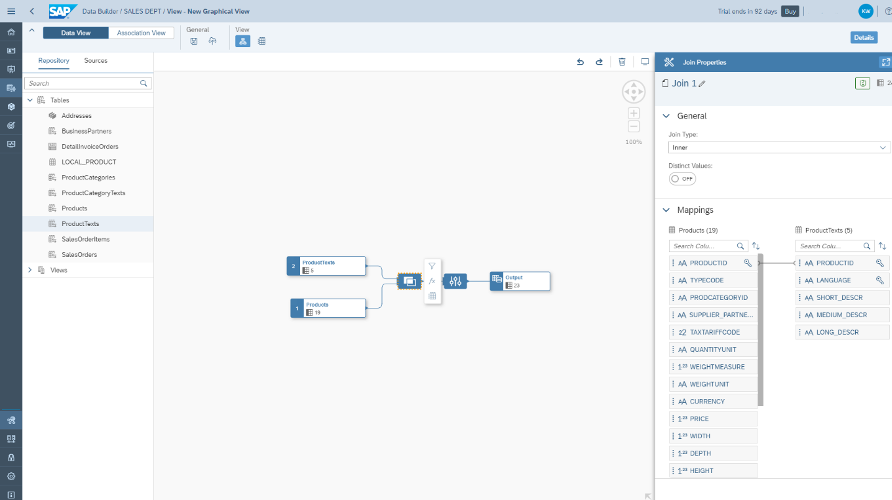
You can now drag and drop other tables or views on top of the one already on the canvas. As you drag the first table or view, you will see a pop-up listing Union and Join.
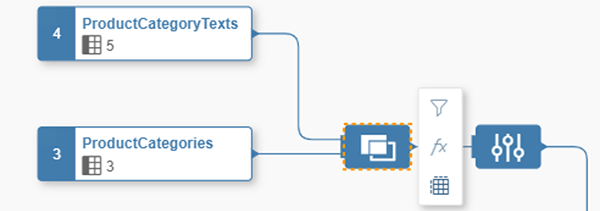
This is your opportunity to choose to make a union of these tables, which would mean an output with the complete contents of both tables or views. If you don’t specifically choose a Union, all tables and views will be joined by default. You don’t have to specifically choose Join, just drop the table and it will automatically be a join. Once you have your first join, you will notice that the canvas rearranges itself to show a Join node and a Projection node. If you click on the Join node, you can see the right sidebar shows details of this join, including which columns are mapped together. You can either change the type of join or change the mappings between the two tables.
Si desea eliminar un mapeo existente, simplemente haga clic en la línea entre las dos columnas y luego haga clic en el icono de la papelera en rojo.
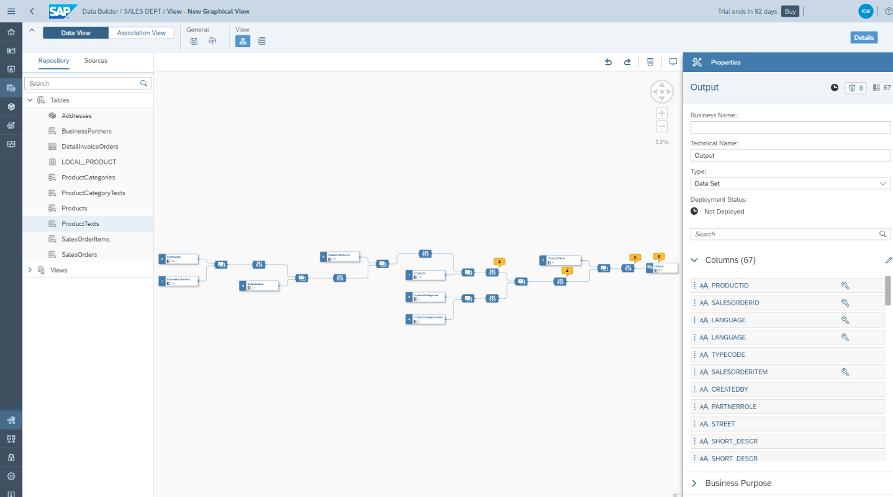
After you add all of your data sources and determine the ways in which these tables or views are connected (or joined), you might notice some yellow alerts on top of some of the Projection nodes.
Por lo general, esto significa que su combinación incluye algunas columnas que tienen exactamente el mismo nombre técnico. Puede hacer clic en uno de los nodos de Proyección con una alerta amarilla, luego hacer clic en el icono del escudo para ver cuál es el problema.
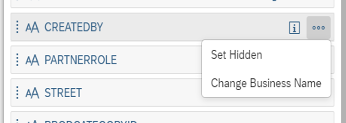
To solve this issue, you can either rename or hide a duplicate column. If you are sure that the columns have exactly the same information, you should hide it. To do that, just click on the column name, then click on Set Hidden. If, however, the column contents are similar, but not exactly the same, you can rename the column to make sure the information is present on your output but does not create issues with duplication.
To rename a column, click on the Projection node, then click on the column you want to rename. This will highlight which table or view this table is coming from.
Once you are sure this is the right column from the right table, just click on the three dots icon and click on Change Business Name.
4.2 Transformación de datos y vista previa
If you want to make sure your data output includes only the right data, you can drill down into your data by choosing to add filters to your join, projection, or output nodes. Just click on the node you want to filter, then click on the Filter icon right next to the node.
Now you will see the Filter Properties on the right sidebar. You can filter based on columns or type in your expressions as needed. All of your changes here are automatically saved, so when you are done, just go to the next step.
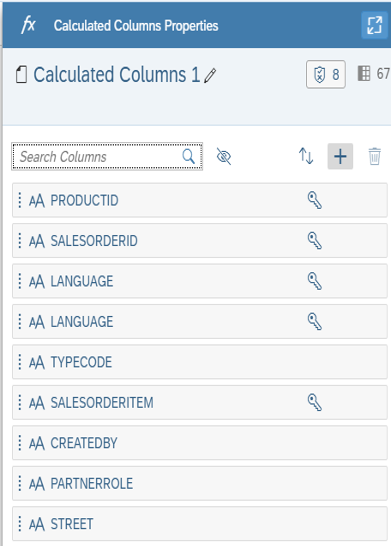
Another transformation you can do with SAP Data Warehouse Cloud is to create a new calculated column and add it to your output. To start, just click on the fx icon next to the output, projection, or join node.
Luego, en la barra lateral derecha, puede seleccionar una columna existente para agregar un cálculo y hacer clic en el ícono de lápiz al lado de la columna. Alternativamente, puede hacer clic en el icono más para agregar una nueva columna calculada.
Nuevamente, puede usar las funciones, columnas y operadores en la barra lateral derecha para crear su cálculo.
Finally, you can see a sample of your data by clicking on the Preview Data button. This button can be found in multiple places. For example, you can click on it next to your output node. You can also click on it on the top menu, next to the Save and Deploy icons.
Alternatively, you can choose to preview just one table or one join. To do that, just click on the Preview Data icon next to the table or node you want to preview.
You will see the preview in the lower center area of the screen. Notice that you can confirm which preview you are looking at by checking the title of the preview in Data Preview: Output.
4.3 Listo para implementar
When you are finished with your data modeling and transformation, you still need to make sure to either save or save and deploy your data model. You should choose Save if you are not yet done with your modeling and still will make changes to it before using the data model in a data story.
If you’ve finished modeling, you can directly click on the Deploy icon to deploy your data model, which also saves it on your Space’s Repository. If you haven’t yet added a business and technical name to this data model, you will be asked to do so when clicking either the Save or Deploy icons. Your data model will be available for use in Data Stories if you determine it is a Fact and after you deploy it successfully.
5. Cómo crear un diagrama entidad-relación
As explained in a previous section, ERDs are the first step to start modeling as you define all your elements and relations between all the elements before you implement it technically. They help you visualize the relationships between your tables and views, as well as the dependencies between them.
To create these diagrams in SAP Data Warehouse Cloud you should follow these steps:
Go to the Data Builder and select your Space.
In the Data Builder, select New Entity-Relationship Model.
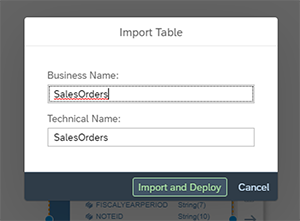
Using your Sources, drag and drop the different tables onto the canvas. When you drag each table, you’ll be prompted to Import and Deploy each table onto the canvas. Make sure to click Yes to add the table to the canvas.
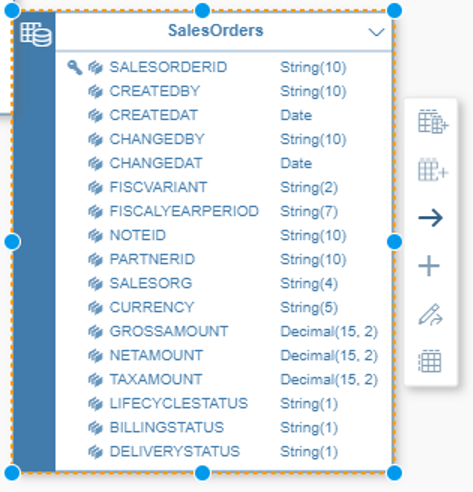
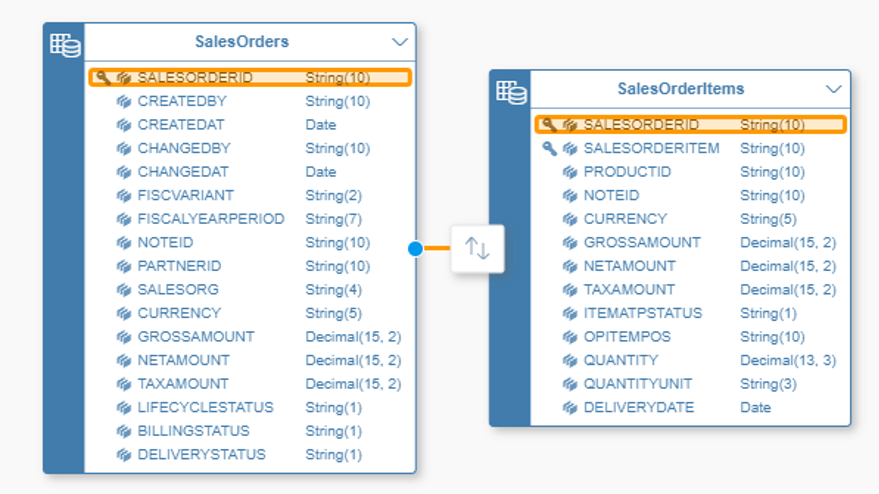
By clicking and dragging the arrow icon onto the logically associated table, you establish a relationship between those two tables in a specific direction. For example, you could connect the table Products to an additional Product Category list, which adds relevant information to the Product table.
Puede ver qué columnas están unidas revisando los resaltados amarillos que se muestran cuando hace clic en la flecha de unión entre dos tablas.
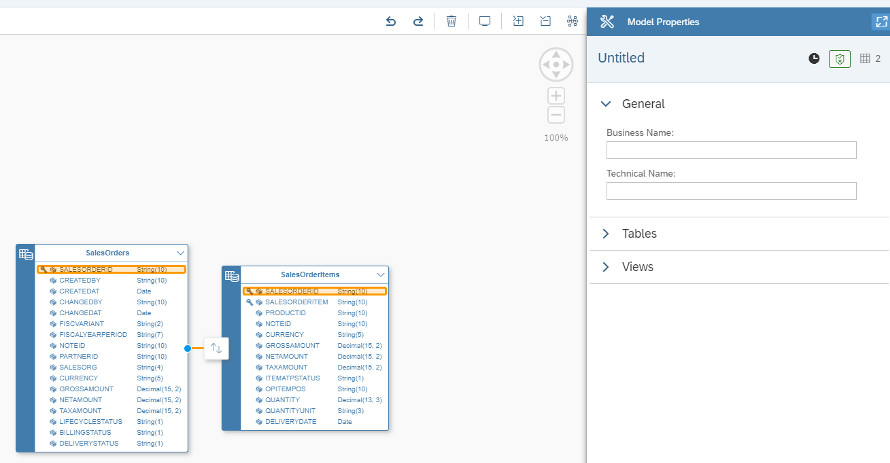
You can now repeat this process for all the tables you wish to include in your ER model. When you’re finished, give your ER Model a Business Name, and change any technical names within the tables to business names that might be clearer. Then click on the Save icon.
You will then be able to see the newly created ER Model in the list of available tables and views in your Data Builder. There are many applications for an ER model, but one that is specific to SAP Data Warehouse Cloud is to enable the Join Recommendation feature within the Data Builder. Once you have your ER model available within your Space, whenever you want to create a Graphical View, you can take advantage of the recommendations of which tables should be joined to the table you dragged to the canvas.
Resumen
Después de leer esta publicación de blog y seguir los ejemplos dados anteriormente, debería estar listo para comenzar a modelar directamente en SAP Data Warehouse Cloud y aplicar los conceptos básicos que se explican aquí.
Para obtener información más detallada sobre elementos como las jerarquías y los editores de SQL, le recomendamos que profundice en los manuales del producto o en los viajes de aprendizaje disponibles en línea. Si tiene consultas específicas sobre la implementación de SAP Data Warehouse Cloud como su almacén de datos empresarial, póngase en contacto con nosotros directamente.
Nuestro próximo artículo se centrará en la creación de historias analíticas en SAP Data Warehouse Cloud, ¡así que recuerde estar atento a nuestro blog!


