
SAP BusinessObjects (BO) BI 4 Platform has come with many improvements that have made the system more complex. Rep-Up-GraphWe, as BI 4 administrators, are required to know how this application works in order to apply the proper optimization improvements to the platform, when it is required. In this blog article, we will cover the most important concepts that need to be considered as a first step to increase the performance of the BI platform. It is very important for a good designer to understand the conceptual tiers in the BI Platform: Application Tier, Intelligence tier and Processing tier. We will refer to each one of them and we will nail down some optimization tips.
Running SAP BusinessObjects Explorer on top of SAP BW
Running SAP Explorer on top of BW This blog describes the only successfully tested way to run SAP Explorer on top of SAP Netweaver Business Warehouse (SAP BW) info-providers. This is not a straight forward configuration and it requires knowledge of Information Design Tool, Data Federator Administration Tool and SAP Logon application for SAP BW.
Handling Formula Errors in Web Intelligence
Do you know what drives your business?
Knowing your business and making smarter decision in order to keep up with the everyday risks involved in running your business is critical in order to survive in today’s global economy.
 Making effective decisions requires information. This information must be accurate and updated, and in the right level of detail that you need to be able to move forward at optimal speed. Key business analytics is what allows you to draw information from the data you collect in the different parts of your business. When you understand exactly what is driving your business, where new opportunities come from, and where mistakes were made, you can be proactive to maximize existing revenues and reveal areas for expansion. Better decisions can be made when you have more visibility into vital insight coming from your own company.
SAP Business Intelligence (BI) Solutions provides a window into your company. A dashboard for example is a single, reliable, and real-time overview of your company. It offers you quick insight, in visual appealing formats that are easy to understand. You also have "What-If" tests that let you measure the business impact of a particular change. This can also be made available on mobile devices, so you can make informed decisions on-the-move. When you have information you can trust, you are able to act rapidly and stay ahead of the game.
With years of expertise in BI, Clariba has helped several companies to draw insight from their data. For example, Vodafone Turkey´s Marketing department sought our help to provide the Customer Value Management Team with a dynamic and user-friendly visualization and analysis tool for marketing campaigns. With the central dashboard we delivered, the marketing team was able to analyze existing campaigns and design outlines for new ones based on key success factors.
You can learn more about SAP BI solutions here, and you can also watch SAP BI Solutions videos on YouTube. Want to unlock this information on what drives your business forward? Contact us on info@clariba or leave a comment below, and discover how SAP BI Solutions can help you achieve it.
BI and Social Media – A Powerful Combination (Part 2: Facebook)
To continue with my Social Media series (read the previous blog here BI and Social Media – A Powerful Combination Part 1: Google Analytics), today I would like to talk about the biggest social network of them all: Facebook. In this blog post, I will explain different alternatives I have recently researched to extract and use information from Facebook to perform social media analytics with SAP BusinessObjects’ report and dashboard tools. In terms of the amount of useful information we can extract to perform analytics, I personally think that Twitter can be as good or even better than Facebook, however, it has around 400 million less users. Facebook still stands as the social network with the most users around the world - 901million at this moment - making it a mandatory reference in terms of social media analytics.
Before we start talking about technical details, the first thing you should understand is that Facebook is strongly focused on user experience, entertainment applications, content sharing, among others. Therefore, the user activity is more dispersed and variable as opposed to the real-time orderly fashion that Twitter gives us, which is so useful when building trends and chronological analysis. Hence, be sure of what you are looking for, stay focused on your key indicators and make sure you are searching for something that is significant and measurable.
Relevant Facebook APIs for Analytical purposes
The APIs (Application Programming Interface) that Facebook provides are largely directed at the development of applications for social networking and user entertainment. However, there are several APIs that can provide relevant information to establish Key Indicators that can later be used to run reports. As Facebook’s developer page1 states: “ We feel the best API solutions will be holistic cross API solutions.” Among the API’s that you will find most useful (labeled by Facebook as Marketing APIs), I can highlight the Graph API, the Pages API, the Ads API and the Insights API. In any case, I encourage you to take a look at Facebook pages and guides for developers, it will be worth your time:
Marketing Developer Program: http://developers.facebook.com/preferredmarketingdevelopers/why_build/
Marketing Developer Resources (with mentions of the APIs above): http://developers.facebook.com/preferredmarketingdevelopers/resources/
Facebook Marketing Solutions: http://www.facebook.com/marketing

Facebook APIs
Third party applications to extract data from Facebook
I only found a few third party applications to extract data from Facebook’s API that were comprehensive enough to ensure reliable access to data. Below are some alternatives designed for this requirement:
GA Data Grabber: This application has a module for the Facebook APIs, which costs 500USD a year. As in the case of Google Analytics, it has key benefits such as ease-of-use and flexibility to make queries. It may also be integrated with some tools from SAP BusinessObjects such as WebIntelligence, Data Integrator or Xcelsius dashboards through LiveOffice.2
Custom Application Development: It is the most popular option, as I already mentioned in my previous post about Google Analytics. The Facebook APIs admit access from common programming languages, allowing to record the results of the queries in text files that can be loaded into a database or incorporated directly into various tools of SAP BusinessObjects.
Implementation of a Web Spider: If the information requirements are more focused on the user’s interactions with your client’s Facebook webpage or any of its related Facebook applications, this method may provide complementary information to that which is available in the APIs. The information obtained by the web spider can be stored in files or database for further integration with SAP BusinessObjects tools. Typically, web spiders are developed in a common programming language, although there are some cases where you can buy an application developed by third parties, as the case of Mozenda.3
Final Thought
As I have mentioned in my previous post, in the area of Social Media new applications and trends are appearing at a hectic pace, a lot of changes are expected to happen, so it is just a matter of time until we have more and better options available. I encourage you to stay curious on Social Media analytics and its most popular networks, because right now this is a growing gold mine of information.

If you have any questions or anything to add to help improve this post, please feel free to leave your comments. You may also find interesting the previous post I wrote about SAP BusinessObjects and Google Analytics: http://juancaruiz.com/clariba/bi-and-social-media-a-powerful-combination-part-1-google-analytics/
References
1 Marketing Developer Program: http://developers.facebook.com/preferredmarketingdevelopers/why_build/
2 GA Data Grabber: http://www.gadatagrabbertool.com/
3 Mozenda: http://www.mozenda.com/
B-tree vs Bitmap indexes: Consequences of Indexing - Indexing Strategy for your Oracle Data Warehouse Part 2
On my previous blog post B-tree vs Bitmap indexes - Indexing Strategy for your Oracle Data Warehouse I answered two questions related to Indexing: Which kind of indexes can we use and on which tables/fields we should use them. As I promised at the end of my blog, now it´s time to answer the third question: what are the consequences of indexing in terms of time (query time, index build time) and storage?
Consequences in terms of time and storage
To tackle this topic I’ll use a test database with a very simplified star schema: 1 fact table for the General Ledger accounts balances and 4 dimensions - the date, the account, the currency and the branch (like in a bank).
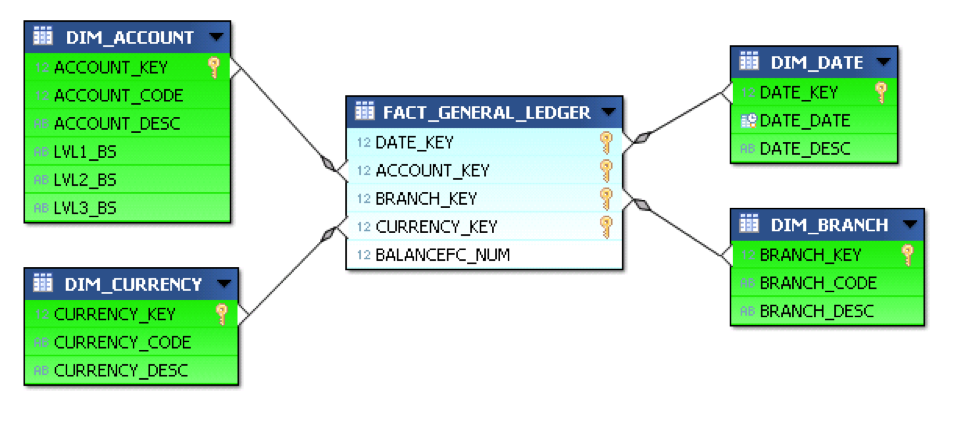
Simplified Star Schema
To give an idea of the table size, Fact_General_Ledger has 4,5 million rows, Dim_Date 14 000, Dim_Account 3 000, Dim_Branch and Dim_Currency less than 200.
We’ll suppose here that the users could query the data with filter on the date, branch code, currency code, account code, and the 3 levels of the Balance Sheet hierarchy (DIM_ACCOUNT.LVLx_BS) . We assume that the descriptions are not used in filters, but in results only.
Here is the query we will use as a reference:
Select
d.date_date,
a.account_code,
b.branch_code,
c.currency_code,
f.balance_num
from fact_general_ledger f
join dim_account a on f.account_key = a.account_key
join dim_date d on f.date_key = d.date_key
join dim_branch b on f.branch_key = b.branch_key
join dim_currency c on f.currency_key = c.currency_key
where
a.lvl3_bs = 'Deposits With Banks' and
d.date_date = to_date('16/01/2012', 'DD/MM/YYYY') and
b.branch_code = 1 and
c.currency_code = 'QAR' -- I live in Qatar ;-)
So, what are the results in terms of time and storage?

Time and Storage Comparison
Some of the conclusions we can draw from this table are:
Using indexes pays off: queries are really faster (about 100 times), whatever the chosen index type is.
Concerning the query time, the index type doesn’t seem to really matter for tables which are not that big. It would probably change for a fact table with 10 billion rows. There seems however to be an advantage to bitmap indexes and especially bitmap join indexes (have a look at the explanation plan cost column).
Storage is clearly in favor of bitmap and bitmap join indexes
Index build time is clearly in favor of b-tree. I’ve not tested the index update time, but the theory says it’s much quicker for b-tree indexes as well.
Ok, I´m convinced to use Indexes. How do I create/maintain one?
The syntax for creating b-tree and bitmap indexes is similar:
Create Bitmap Index Index_Name ON Table_Name(FieldName)
In the case of b-tree indexes, simply remove the word “Bitmap” from the query above.
The syntax for bitmap join indexes is longer but still easy to understand:
create bitmap index ACCOUNT_CODE_BJ
on fact_general_ledger(dim_account.account_code)
from fact_general_ledger,dim_account
where fact_general_ledger.account_key = dim_account.account_key
Note that during your ETL, you’d better drop/disable your bitmap / bitmap join indexes, and re-create/rebuild them afterwards, rather than update them. It is supposed to be quicker (however I’ve not made any tests).
The difference between drop/re-create and disable/rebuild is that when you disable an index, the definition is kept. So you need a single line to rebuild it rather than many lines for the full creation. However the index build times will be similar.
To drop an index: “drop index INDEX_NAME”
To disable an index: “alter index INDEX_NAME unusable”
To rebuild an index: “alter index INDEX_NAME rebuild”
Conclusion
The conclusion is clear: USE INDEXES! When properly used, they can really boost query response times. Think about using them in your ETL as well: making lookups can be much faster with indexes.
If you’d like to go any further I can only recommend that you read the Oracle Data Warehousing Guide. To get it just look for it on the internet (and don’t forget to specify the version of your database – 10.2, 11.1, 11.2, etc.). It’s a quite interesting and complete document.
B-tree vs Bitmap indexes - Indexing Strategy for your Oracle Data Warehouse Part 1
Some time ago we’ve seen how to create and maintain Oracle materialized views in order to improve query performance. But while materialized views are a valuable part of our toolbox, they definitely shouldn’t be our first attempt at improving a query performance. In this post we’re going to talk about something you’ve already heard about and used, but we will take it to the next level: indexes.
Why should you use indexes? Because without them you have to perform a full read on each table. Just think about a phone book: it is indexed by name, so if I ask you to find all the phone numbers of people whose name is Larrouturou, you can do that in less than a minute. However if I ask you to find all the people who have a phone number starting with 66903, you won’t have any choice but reading the whole phone book. I hope you don’t have anything else planned for the next two months or so.

Searching without indexing
It’s the same thing with database tables: if you look for something in a non-indexed multi-million rows fact table, the corresponding query will take a lot of time (and the typical end user doesn’t like to sit 5 minutes in front of his computer waiting for a report). If you had used indexes, you could have found your result in less than 5 (or 1, or 0.1) seconds.
I’ll answer the following three questions: Which kind of indexes can we use? On which tables/fields shall we use them? What are the consequences in terms of time (query time, index build time) and storage?
Which Kind Of Indexes Can We Use?
Oracle has a lot of index types available (IOT, Cluster, etc.), but I’ll only speak about the three main ones used in data warehouses.
B-tree Indexes
B-tree indexes are mostly used on unique or near-unique columns. They keep a good performance during update/insert/delete operations, and therefore are well adapted to operational environments using third normal form schemas. But they are less frequent in data warehouses, where columns often have a low cardinality. Note that B-tree is the default index type – if you have created an index without specifying anything, then it’s a B-tree index.
Bitmap Indexes
Bitmap indexes are best used on low-cardinality columns, and can then offer significant savings in terms of space as well as very good query performance. They are most effective on queries that contain multiple conditions in the WHERE clause.
Note that bitmap indexes are particularly slow to update.
Bitmap Join Indexes
A bitmap join index is a bitmap index for the join between tables (2 or more). It stores the result of the joins, and therefore can offer great performances on pre-defined joins. It is specially adapted to star schema environments.
On Which Tables/Fields Shall We Use Which Indexes?
Can we put indexes everywhere? No. Indexes come with costs (creation time, update time, storage) and should be created only when necessary.
Remember also that the goal is to avoid full table reads – if the table is small, then the Oracle optimizer will decide to read the whole table anyway. So we don’t need to create indexes on small tables. I can already hear you asking: “What is a small table?” A million-row table definitely is not small. A 50-row table definitely is small. A 4532-row table? I´m not sure. Lets run some tests and find out.
Before deciding about where we shall use indexes, let’s analyze our typical star schema with one fact table and multiple dimensions.
Star schema with one fact table and multiple dimensions
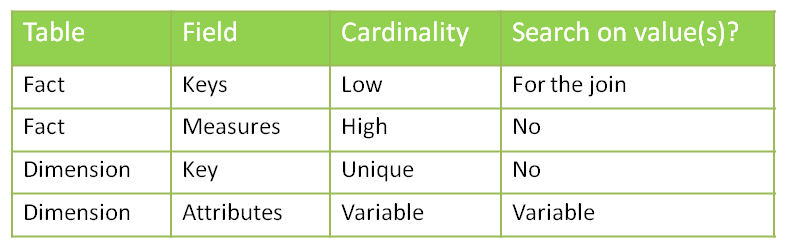
Let’s start by looking at the cardinality column. We have one case of uniqueness: the primary keys of the dimension tables. In that case, you may want to use a b-tree index to enforce the uniqueness. However, if you consider that the ETL preparing the dimension tables already made sure that dimension keys are unique, you may skip this index (it’s all about your ETL and how much your trust it).
We then have a case of high cardinality: the measures in the fact table. One of the main questions to ask when deciding whether or not to apply an index is: “Is anyone going to search a specific value in this column?” In this example I´ve developed I assume that no one is interested in knowing which account has a value of 43453.12. So no need for an index here.
What about the attributes in the dimension? The answer is “it depends”. Are the users going to do searches on column X? Then you want an index. You’ll choose the type based on the cardinality: bitmap index for low cardinality, b-tree for high cardinality.
Concerning the dimension keys in the fact table, is anyone going to perform a search on them? Not directly (no filters by dimension keys!) but indirectly, yes. Every query which joins a fact table with one or more dimension tables looks for specific dimension keys in the fact table. We have got two options to handle that: putting a bitmap key on every column, or using bitmap join keys.
Further Inquiries...
Are indexes that effective? And what about the storage needed? And the time needed for constructing/ refreshing the indexes?
We will talk about that next week on the second part of my post.
Asista al SAP Roadshow Innova Pyme 2012 con Clariba y com&Geinsa

Descubra como las aplicaciones de análisis de negocio de SAP le pueden ayudar a acceder a información en la que basar sus decisiones con seguridad y actuar para mejorar el rendimiento de su empresa.

Atienda a nuestro evento el 4 de Julio de 10:30 a 12:30 y descubra lo que su empresa puede lograr con las soluciones SAP.
En el SAP Roadshow Innova Pyme 2012 usted tendrá la oportunidad de hablar con los consultores de com&Geinsa y Clariba, partners de SAP con años de experiencia en soluciones de gestión de la información. Ellos le proporcionarán información sobre cualquier consulta que formule, o concretaremos el poderle ver con una atención más personalizado.
La agenda del evento es la siguiente:
- Cafes y pastas de bienvenida
- Introducción
- Presentación de SAP BI para BusinessOne
- Demostración del Cuadro de Mandos para Finanzas y Ventas
- Preguntas y respuestas
- Agradecimientos y Despedida
Esperamos verle próximamente en nuestro SAP Roadshow Innova Pyme 2012. El evento es gratuito, para registrarse por favor HAGA CLIC AQUÍ.
Un cordial saludo,
Marc Haberland Director General Clariba
_______________________________________________________________
Acerca de Clariba
Clariba ofrece soluciones innovadoras y fiables en business intelligence, proporcionando a clientes en más de 15 países la visión que necesitan para mejorar su rendimiento empresarial. Nuestros consultores son certificados y expertos en la planificación, desarrollo y instalación de SAP BusinessObjects. www.clariba.com
Acerca de com&Geinsa
com&Geinsa lleva más de 30 años aportando soluciones para rentabilizar al máximo los sistemas de información de su empresa, sin perder de vista la evolución de la tecnologías como movilidad y cloud. En com&Geinsa somos expertos en hacer de SAP una solución única para su empresa. www.comgeinsa.com
What keeps you up at night? Information Management Nightmares
Clariba recently carried out a survey about information management with participants at an event. The results were quite interesting since we had most participants mentioning the same pain points; therefore we have decided to share them in this article. To carry out the survey, we used simple statements that people could identify themselves with - divided into two areas: Business and Technical. We then asked participants to fill a one-page questionnaire, asking them to check all the pain points they were facing (they could check multiple pain points).

BI Pain Points questionnaire
Business Pain Points
When it came to the business side, 45% of respondents affirmed that their boss constantly pushes them for more information. This is a very sensitive topic. We all know that companies can´t afford to make decisions that aren´t based on facts. Therefore if you are the responsible for gathering these facts, you will be under constant pressure. This would be something simple to deal with if it was easy to gather the information you need. However, when we see that 35% of participants complained they are spending too much time consolidating information and 30% did not manage to get all the information they need, we understand why this becomes a big issue. Business intelligence platforms should not only provide you with all the insight you need, but should make it easily available. It can be a daunting task when you have to wait for IT to return queries for a business question you have to answer or when you have to compare 3 different sources of data to find out the true value before a meeting taking place 1 hour from now.
Another common dissatisfaction was around data obsolescence. 40% said their BI systems only provides historical data and they can´t see how the company is performing right now. This can be caused by not having a proper data warehouse in place, or having one that is not refreshed as often as it should or having poorly designed ETL processes. Whatever the reason is, it can lead to poor decision making. When business moves at the speed of light (in a call center for example), to rely on old information can be misleading.
Another issue related to data obsolescence appeared when 40% said they like Microsoft Excel as a tool to manipulate information, but they are not getting fresh data. If you have to prepare presentations or send emails that include Microsoft Excel data, and you have to manually update them not only will you spend a lot of your time on it, but you are also subject to making mistakes. Business intelligence tools must allow users to optimize their time, while reducing manual labor thus minimizing mistakes.

Survey Results - Business
Technical Pain Points
On the technical side of our survey, the most common complaint was around workload related to information management. 55% of participants stated that their department is completely overloaded. This is also connected to another popular complaint: 45% of respondents state that they have system users calling them all the time. If users don´t have the autonomy to create their own reports and need IT for every query they have to run, the department will become a bottleneck. That´s why offering business users easy-to-use tools that give them the freedom they need to draw insight from corporate data on their own is so important, as it speeds up the information sharing process.
Another frequently mentioned pain point on the technical side is that 40% respondents are not getting the support they need for their BI system. When a problem happens in the BI platform, the impact on a company can be huge, as people make their decisions without trustworthy data to guide them. Therefore, the right support is vital to the correct function of a business, both in SAP licenses and on the BI solutions implemented.
Finally, 35% of respondents don't have the visibility into how their BI systems are being used. When IT has no idea how the system is being used, they cannot optimize the server and the licensing, they can´t understand their users and they can´t be proactive, forecasting when changes will be needed. They need to be able to understand what is going on in their BI applications and ensure BI environments are performing appropriately.
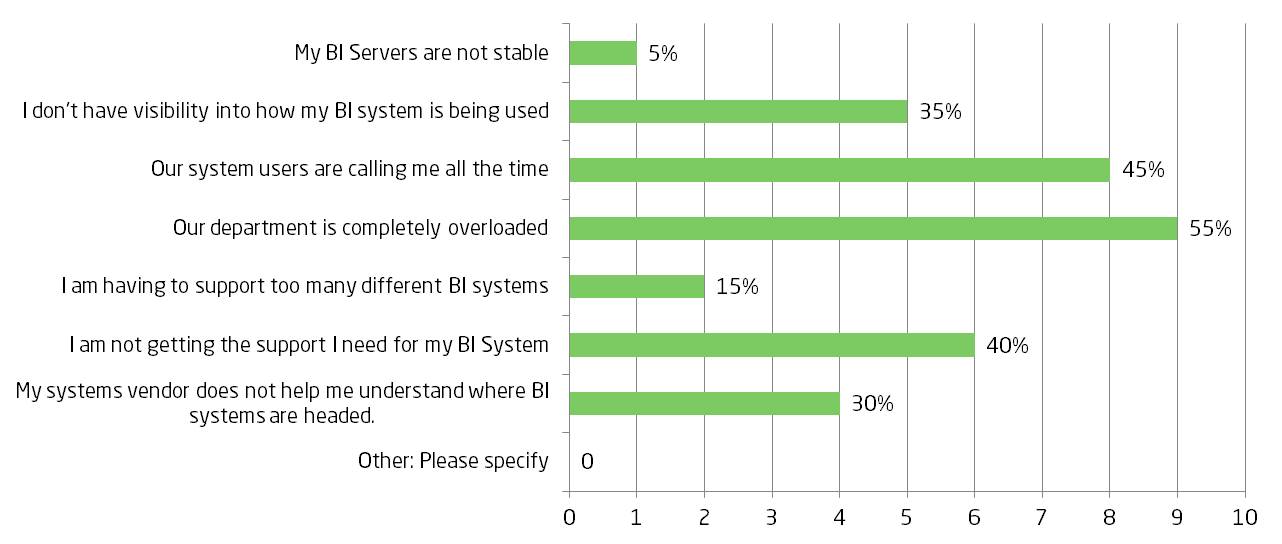
Survey Results - Technical
How to Solve These Issues?
Whether you use Microsoft Excel, a legacy BI system or an SAP BI solution, Clariba can help you solve data management issues that you face on a daily basis. Clariba´s solutions, which are based on SAP BusinessObjects, the leading BI platform in the market today, can help business users and IT departments to resolve their concerns.
With the full range of SAP BusinessObjects BI modules we are able to provide companies with the solutions they need. We are also capable of developing optimal ETL processes and Data Warehousing with our Data Management services to make sure you have high quality data analysis.
Furthermore, we can ensure your systems are performing to their maximum capacity. Our Support Center has been certified by SAP to provide support on SAP BusinessObjects licenses and also on BI systems and implementation. If what you are looking for is to monitor your BI system, we have recently developed PerformanceShield, a solution that ensures an effective management of your Business Intelligence (BI) system, which is critical to guarantee your organization is optimizing its investments on BI.
Not sure where to begin? The first step is a 360 BI Assessment, based on best practices and an in-depth understanding of your BI platform, tools, content and licenses. If your current BI system has any gaps or challenges, SAP BusinessObjects and Clariba will recommend steps for making it more secure, stable or efficient for all your users and audiences.
If you feel any of the pain points mentioned, or any of the other ones that appear in the graphs, contact Clariba and find out how you can make the best of your investments in business intelligence.
Working with Data Services 4.0 repositories
On my previous blog, “Installing Data Services 4.0 in a distributed environment” I mentioned there was an important step to be carried out after installing data services in a distributed environment: configure the repositories. As promised, I will now walk you through this process. Data Services 4.0 can now be managed using the BI Platform for security and administration. This puts all of the security for Data Services in one place, instead of being fragmented across the various repositories. It means that Data Services repositories are managed through the Central Management Console. With Data Services 4.0 you will be able to set rights on individual repositories just like you would with any other object in the SAP BusinessObjects platform. What is particularly interesting about managing Data Services security using CMC is that you can assign rights to the different Data services repositories.
Data Services Application in CMC
Now you can log into Data Services Designer or Management Console with your SAP BusinessObjects user ID instead of needing to enter database credentials. Once you log into Designer, you are presented with a simple list of Data Services repositories to choose from.
I advice anyone who is beginning to experiment with Data Services to use the repositories properly from the start! At first it might seem really tough, but it will prove to be very useful. SAP BusinessObjects Data Services solutions are built over 3 different types of meta-data repositories called central, local and profile repository. In this article I am going to show you how to configure and use the central and the local repository.
The local repositories can be used by the individual ETL developers to store the meta-data pertaining to their ETL codes, the central repository is used to "check in" the individual work and maintain a single version of truth for the configuration items. This “check in” action allows you to have a version history from which you can recover older versions in case you need it.
Now lets see how to configure the local and central repository in order to finish the Data Services’ installation.
So, let’s start with the local repository. First of all, go to Start Menu and start Data Service Repository Manager Tool.
Choose “Local” in the repository type combo box. Then, enter the information to configure the meta-data of the Local Repository.
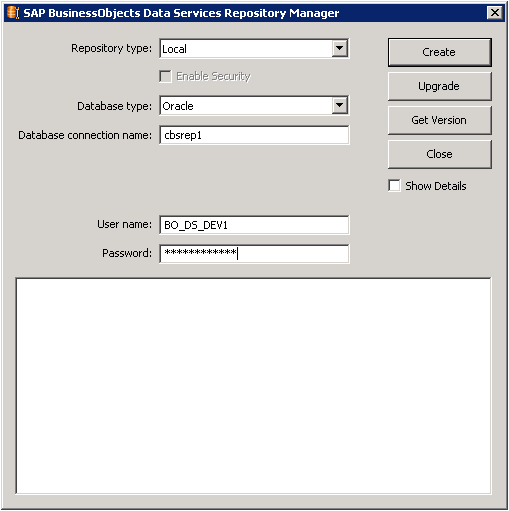
Configuring Local repository
For the central repository chose central as repository type and then enter the information to configure the meta-data of the Central Repository. Check the check box “Enable Security”.
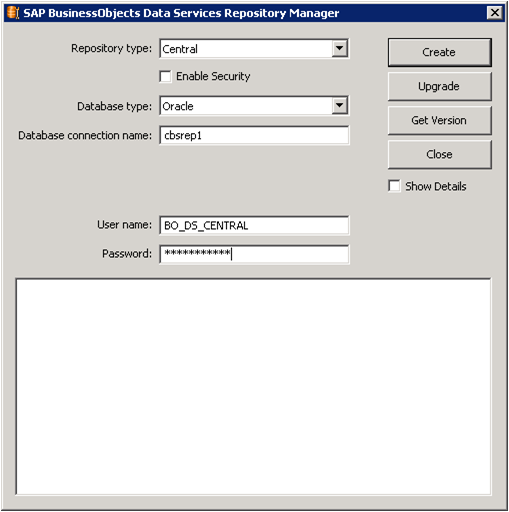
Configuring Central repository
After filling in the information, press Get Version in order to know if there is connection with the data base. If there is connection established, press Create.
Once you have created the repositories you have to add them into the Data Service Management Console. To do that log in DS Management Console. You will see the screen below.
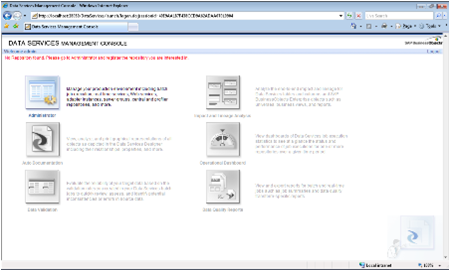
DS Management Console Error
This error is telling you that you have to register the repositories. The next steps is to click on Administrator to register the repositories.
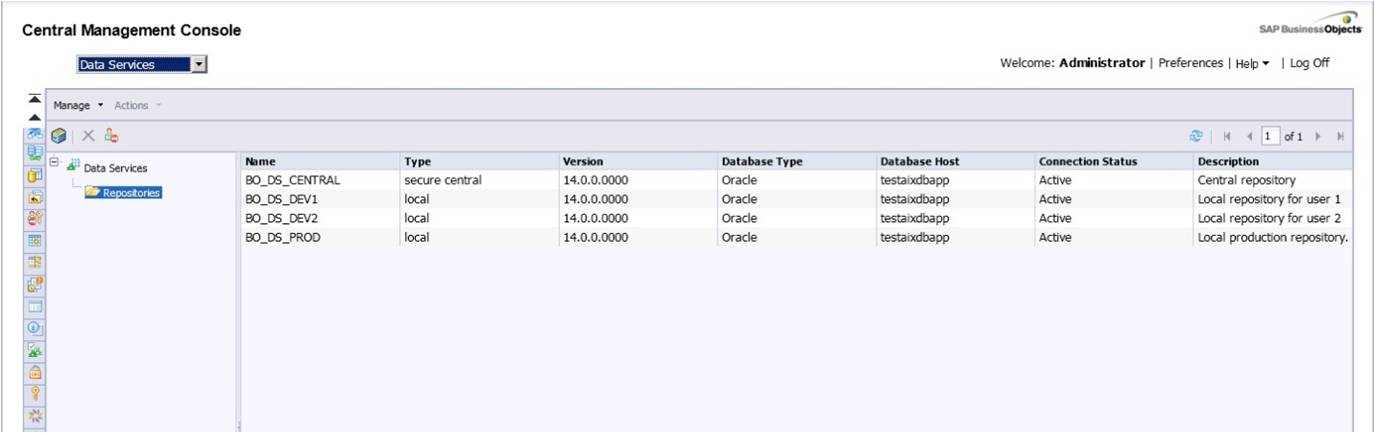
On the left pane, click on Management list item. Then click on Repositories and you will see that there are no repositories registered on it. In order to register them, click the Add button to register a repository in management console.
Finally, write the repository information and click Test to check the connection. If the connection is successful, click apply and then you will be able to see the following image which contains the repositories that you have created. DO NOT forget to register the central repository.

DS Management console
After that, the next logical step is to try to access Data Services using one of the local repositories. Once inside the Designer, activate the central repository that you have created. Data services will display an error telling you that you do not have enough privileges to activate it.
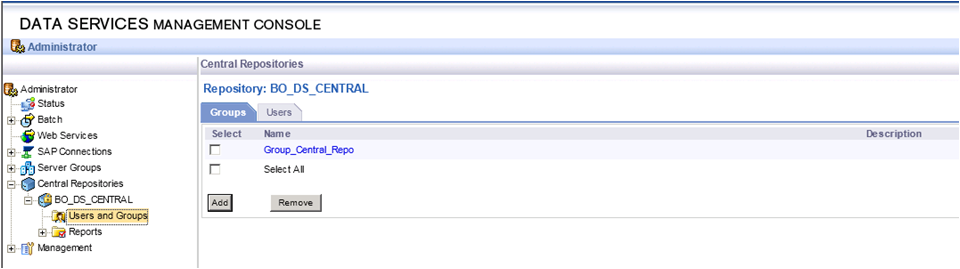
To be able to active the central repository you have to assign the security. To do that go to Data Services Management Console. In the left pane go to “Central Repository” and click on “users and groups”.

Central repository - Users and groups
Once you are inside Users and Groups, click “add” and create a new group. When the group is created select it and click on the “users” tab which is on the right of the group tab (see the image below).
Add and Create new group
Now you can add the names of the users that can activate and use the central repository in the designer tool. As you can see in the image below the only user that you added in the example is the “Administrator”.
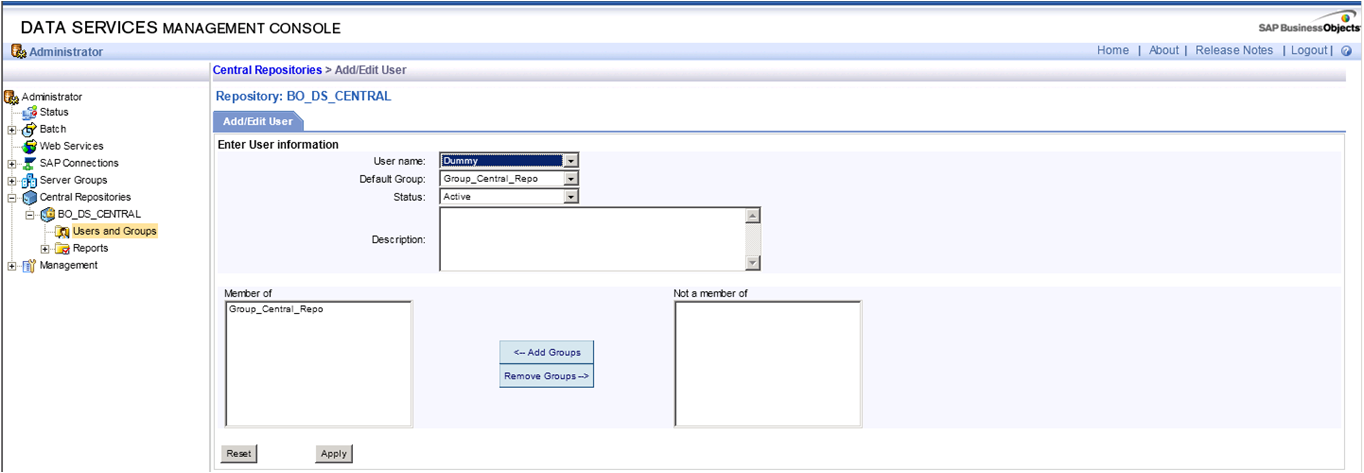
Add user names
Now the last task is to configure the Job Server to finish the configuration.
As always, go to Start Menu and start Server Manager Tool. Once you start the Server Manager the window below appears.
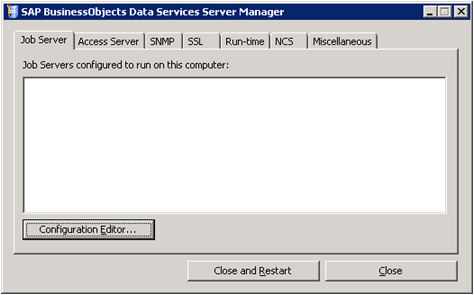
Server Manager tool
Press Configuration Editor a new window will be opened. Press Add and you will have a new job server.
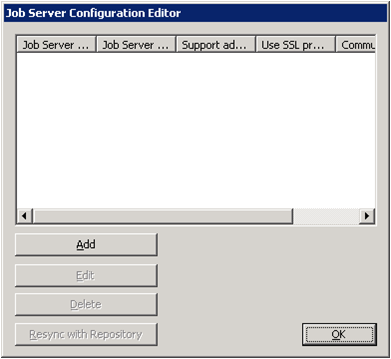
Configuration editor
Keep the default port and choose a name or keep the default one for the new Job server. Then press Add to associate the repositories with the job server created.
Once you press “Add” you will be able to add information in the right part of the window “Repository Information”. Add the information of the local repositories that you have created in the previous steps.
At the end you will see two local repositories associated.

Add Repository Information
With this step you have already finished the repository configuration and are now able to manage the security from the CMC and use the regular BO users to log into the designer and add security to the Data Services repositories like you do with every BusinessObjects application.
If you have any questions or other tips, share it with us by leaving a comment below.