
Uno de nuestros clientes nos presentó un desafío al preguntarnos si era posible abrir una carpeta o categoría en InfoView a través de una URL. Investigando un poco, descubrimos que en BO3 no hay una solución oficial de SAP para esto (nota SAP 1390226), sin embargo, encontramos algunas soluciones sobre cómo lograrlo, pero el verdadero desafío era que ninguno de estos admitía SingleSignOn, así que cada vez el usuario final hizo clic en la URL antes de ingresar en InfoView, la pantalla de inicio de sesión apareció.
Consejos y trucos sobre HTLM5 Dashboard conversion for BI Mobile
Aproveche al máximo su SAP Strategy Management 10.0
Ha implementado con éxito SAP Strategy Management (SSM) en su empresa y los usuarios se están familiarizando gradualmente con esa nueva herramienta. ¿Que sigue? ¿Cómo motivamos a los gerentes para que lo adopten y lo usen como apoyo para sus tareas de toma de decisiones? En este artículo me gustaría compartir mis pensamientos sobre los siguientes temas
Common SAP Dashboards (Xcelsius) bugs and how to solve them
This post is about SAP BusinessObjects Dashboards (formerly known as Xcelsius) and its intricate form of work. If you are an assiduous dashboard developer or just beginning to work with the tool, you will notice some bugs that interfere with your developing and slows you down. My main goal is to talk about the bugs or "misfortunes" that I have commonly faced in SAP BO Dashboards (Xcelsius) and the workarounds that I have found to save you some time when working with this tool. My second objective is to open a discussion where you can comment on other SAP Dashboards issues and solutions you found.
Integración de tablero en SAP Crystal Reports
In this blog article I would like to share with you how to embed a dashboard in a Crystal Report using flash variables. First of all let’s give a scenario that leads us to do that. In this case we wanted to create a dashboard for a SAP GRC module. The problem was that we could not connect to the system directly with SAP BusinessObjects Dashboards (Xcelsius for the most nostalgic ones). Apart from that, there is a good thing about having a dashboard embedded in Crystal, you will have a dashboard that can be refreshed from Crystal Reports without needing a previous authentication. You will also be able to save the “report” (you can show the dashboard) in PDF with saved data and the dashboard will be completely clickable and navigable.
Proporcionar datos de SSM a herramientas de generación de informes de SAP BusinessObjects - Exhausting all scenarios
In the last two months I have been in a couple of customers who were interested in the integration of SAP Strategy Management 10.0 with SAP BusinessObjects BI Platform 4.0. In this post I would like to explain what that integration is about.
First of all, a brief introduction about the solution. The SAP Strategy Management (SSM) software allows aligning the Strategy Plan of the company and its key objectives and spread it across all the organization. It is an out of the box Enterprise Performance Management solution in which you can insert the most important KPIs of your company in Balanced Scorecards or Strategy Maps and control their performance in relation to the Strategy of the company. Within SSM you can also create initiatives to implement improvements or corrective actions and link them to the objectives or KPIs.
Sometimes the customer has requirements to implement reports or further analysis on top of SSM and these cannot be covered with the standard functionality of the solution. In that case, the best option is to implement the integration between SSM and SAP BusinessObects reporting tools. Some examples of what you can do with that integration:
- Implementar paneles de medida a medida con los KPI y objetivos de SSM
- Implementar universos y permitir a los usuarios explotar información de SSM con Web Intelligence sin consumir licencias SSM adicionales
- Implemente Crystal Reports perfectos en la parte superior del SSM
- Fomentar la propiedad con Publicaciones. Por ejemplo, envíe una lista de KPI que no están funcionando bien a sus usuarios responsables
Para implementar dicha integración, puede seguir la guía de configuración de SAP SSM. Sin embargo, en algunos casos, hay falta de documentación y hay que hacer cosas fuera del script. En otros casos, la documentación existente no se ha actualizado todavía a BI 4.0 y SSM 10.0. Y finalmente, a veces la documentación es incorrecta o el software tiene errores y no se puede configurar la integración.
En este post analizaremos los siguientes escenarios:
- Informes de Web Intelligence sobre los modelos SSM
- Informes de Web Intelligence sobre un modelo de datos SSM (solución desarrollada por Clariba)
- Crystal Reports en la parte superior de SSM (explorando diferentes opciones)
- Dashboards en la parte superior de SSM (explorando diferentes opciones)
Estos escenarios se han implementado con los siguientes componentes de software:
- SAP NetWeaver 7.3 SP08
- SAP SSM 10.0 SP06
- Plataforma de BI de SAP BusinessObjects 4.0 SP05
- Informes de Crystal 2011 SP05
- Cuadros 4.0 SP05
1. Informes de Web Intelligence sobre un modelo SSM
Según la documentación de SAP, podemos configurar el proveedor de ODBO para construir un Universo en la parte superior de los modelos SSM. El problema es que todavía tenemos que usar el Diseñador de Universo en lugar de la Herramienta de Diseño de Información del BI 4.0. A continuación se indican los pasos para configurar el proveedor ODBO e implementar su primer informe en la parte superior del SSM:
- Vaya a su servidor BO 4.0 y asegúrese de tener un Servicio de Análisis Multimensional en el servidor BO. Detenga el servidor MDAS y el servidor de conexión en el Administrador de configuración central
- Copie la carpeta ODBOProvider de la ruta <DRIVE>: Archivos de programa (x86) SAP BusinessObjectsStrategy ManagementInternetPub de su servidor SSM al servidor BO
- En el servidor SSM, ejecute el archivo SSMProviderReg.bat en el servidor BO. Asegúrese de tener derechos de administrador en el servidor BO. Una vez completado, compruebe en el regedit que es capaz de encontrar el registro SSMProvider. 1 en el registro de Windows
- Modifique el registro de Windows para insertar la cadena siguiente en esa ruta (suponiendo que está utilizando una ventana de 64 -bit): HKEY_LOCAL_MACHINESOFTWAREWow6432NodeSAPSSMODBOProvider "servletUri" = "/ strategyServer / ODBOProviderServlet"
- Acceda a la siguiente ruta en el servidor BO: <DRIVE>: Archivos de programa (x86) SAP BusinessObjectsSAP BusinessObjects Enterprise XI 4.0 dataAccessconnectionServeroledb_olap
<DataBase Active="Yes" Name="Strategy Management 10.0">
<Aliases>
<ALIAS> Gestión de estrategias 10.0 </ALIAS>
</Aliases>
<LIBRARY> dbd_sqlsrvas </LIBRARY>
<Parameter Name="Family"> SAP BusinessObjects </>
<Parameter Name="Extensions"> Sqlsrv_as2005, sqlsrv_as, oledb_olap </>
<Parameter Name="MSOlap CLSID"> SSMProvider. 1 </>
</DataBase>
- Inicie el servidor MDAS y el servidor de conexión
- Ahora podemos ir al Universe Designer y empezar a implementar un Universo en la parte superior de nuestro Modelo. El primer paso es definir la conexión. En la lista de conexiones (recuperada del servidor de conexión) podemos ver ahora el nuevo registro que hemos insertado, Strategy Management 10.0:
- Defina los parámetros de conexión. Debe ser un usuario SSM con los permisos adecuados y debe informar a la dirección completa del servidor (FQDN) y su puerto.


- Una vez conectado al servidor SSM, verá la lista de cubos disponibles. La categoría AS permite acceder a las medidas (basadas en atributos y dimensiones) en el modelo de Application Server. El adaptador SM permite el acceso a la dimensión de la estrategia, que representa las dimensiones de gestión de la estrategia Scorecard e Iniciativa. No se presentan los detalles del Scorecard que no estén relacionados con el KPI, tales como los comentarios.

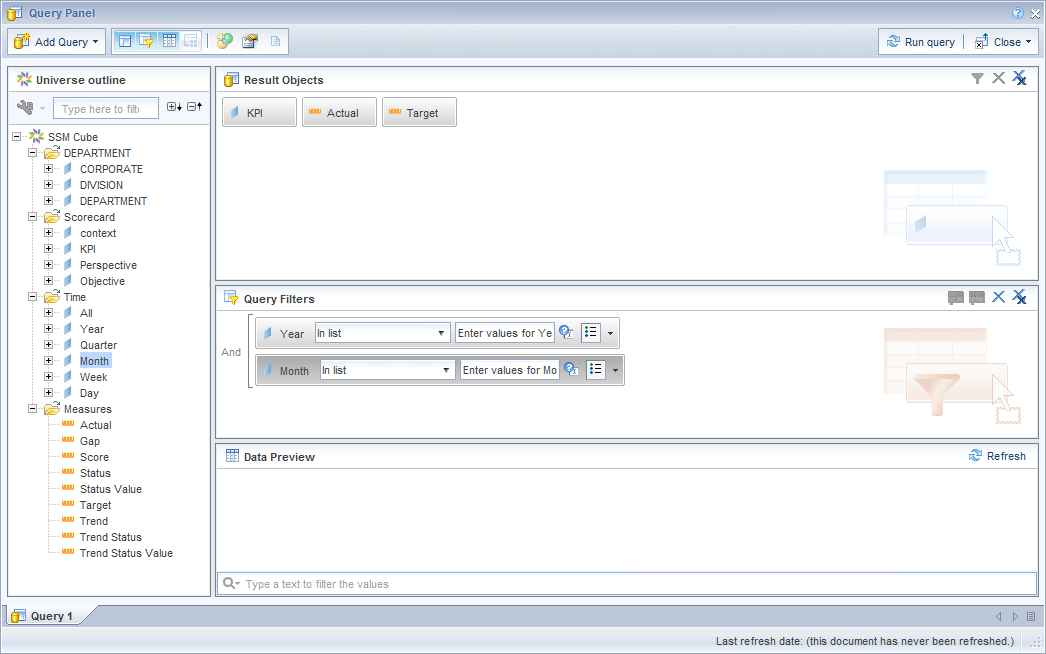
- Y finalmente veremos nuestro universo con las dimensiones disponibles, las clases estándar (Time y Scorecards) y las medidas. Puede mostrar los nombres técnicos de los objetos como detalle o puede definir jerarquías de Perspectivas, Objetivos y KPIs.

- Ahora podemos publicar el universo e ir a la Web Intelligence para comenzar a implementar nuestros informes sobre los modelos SSM.
2. Informes de Web Intelligence sobre el modelo de datos SSM
Esa es una solución que puede implementar si tiene un conocimiento avanzado del modelo de datos SSM. Puede implementar un Universo UNX con la Herramienta de Diseño de Información enlazando todas las tablas de la Entrada y Aprobación, los Nodos del Scorecard, el Creador de Cubos o las Iniciativas. Las ventajas de esta opción son que tiene acceso a información adicional no disponible en el Cubo de SSM, como las Iniciativas, los usuarios relacionados con los KPI específicos, los atributos de los KPI, etc.

If you are interested in such an option, please, contact us. Keep in mind that it is not a supported option from SAP but we have implemented it many times and we know it works.
3. Crystal Reports on top of SSM
La integración de SAP Crystal Reports con SSM se puede realizar de 4 maneras diferentes:
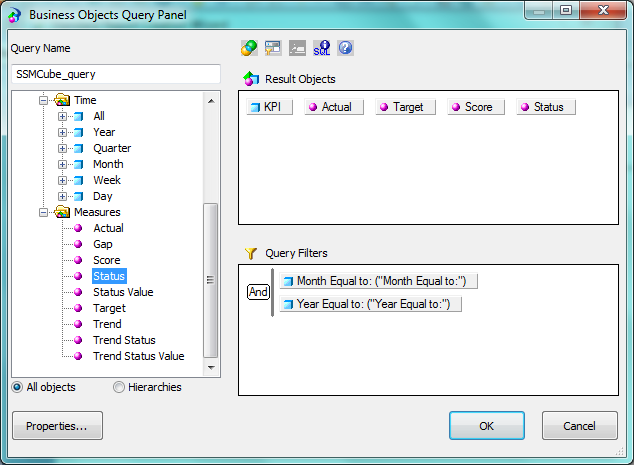
- Implementación de una consulta como un servicio Web desde el universo, construido en pasos anteriores: hemos logrado implementar ese escenario
- Conectando Crystal Reports al Universo encima de los Modelos SSM que hemos construido en el primer paso: ese escenario no funciona aunque seguimos las instrucciones de SAP
- Uso de una conexión OLE DB (ADO): esta opción, no explicada por SAP, está disponible si instalamos el proveedor ODBO pero no hemos logrado que funcione

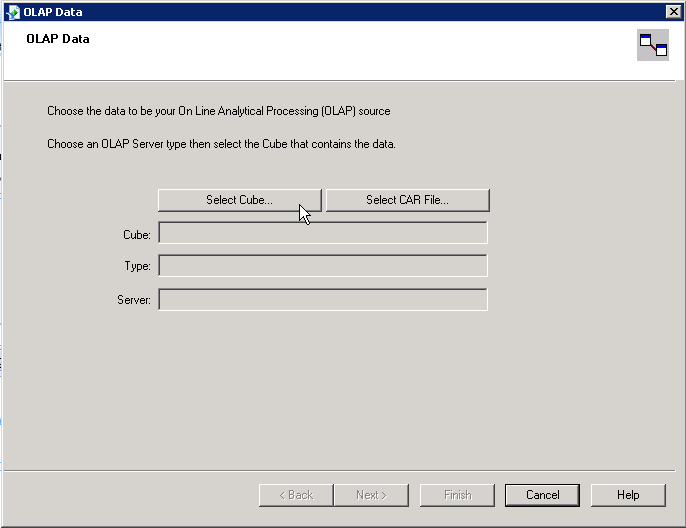
- Uso de la conexión OLAP: de acuerdo con la documentación SAP, podemos crear un informe de cubo OLAP en Crystal Reports. Debemos ser capaces de seleccionar la opción de gestión de estrategia en la siguiente pantalla para insertar datos de conexión SSM, pero no hemos podido encontrar esa opción

4. Cuadros de mando que utilizan conexiones de servicios web
Utilizando Dashboards, tiene dos formas diferentes de implementar el acceso a los datos:
- Implementar una consulta como un servicio Web (QaaWS) para recuperar la información relevante de los universos que habíamos implementado antes.
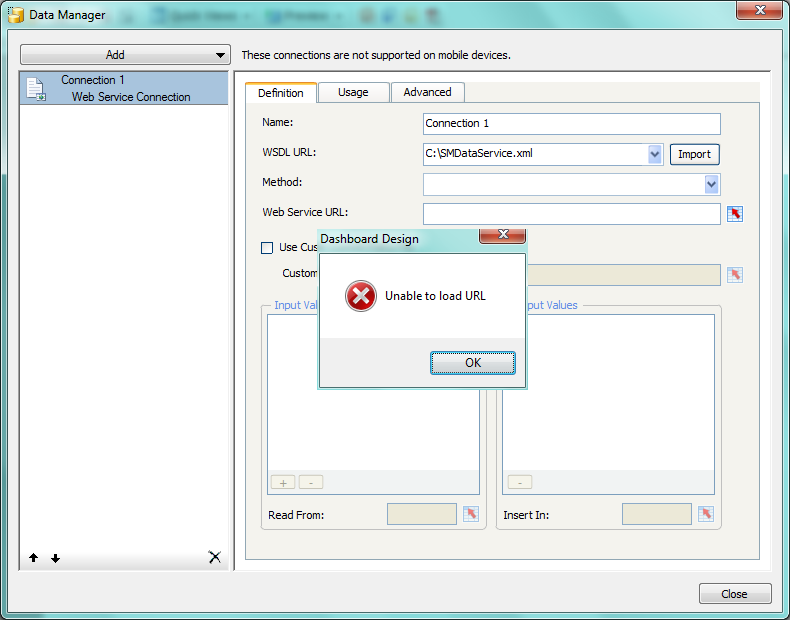
- Utilice los Servicios Web disponibles en SAP NetWeaver para recuperar información del SSM: de acuerdo con la documentación SAP necesita descargar el archivo WSDL SMDataServiceService y las aplicaciones CubeServiceService y llamar a las funciones dentro de ellos. Con nuestros Dashboards 4.0 SP05 no hemos podido procesar los archivos WSDL ya que la herramienta no puede cargar la URL.
Resumen
Proporcionar información de SAP Strategy Management a SAP BusinessObjects BI Platform 4.0 puede mejorar las capacidades de su sistema Strategy. Sin embargo, la integración no es tan fácil dada la falta de información sobre ese tema y la calidad de la información existente. Intentamos implementar todos los posibles escenarios de integración y hemos tenido éxito con Web Intelligence y esta es la ruta que recomendamos, ya que los escenarios relacionados con Crystal Reports y Dashboards no funcionaban al usar SSM 10.0 y BI 4.0.
Estaremos siguiendo estos temas y le informaremos si finalmente logramos resolverlos. Si tiene alguna sugerencia o si encontró una solución a estos problemas, por favor deje un comentario a continuación.
¿Sabe qué es lo que impulsa su negocio?
Conocer su negocio y tomar decisiones más inteligentes con el fin de mantenerse al día con los riesgos cotidianos involucrados en el funcionamiento de su negocio es fundamental para sobrevivir en la economía global de hoy.
 Tomar decisiones efectivas requiere información. Esta información debe ser precisa y actualizada, y en el nivel de detalle adecuado que necesita para poder avanzar a una velocidad óptima. Análisis de negocio clave es lo que le permite dibujar información de los datos que recopila en las diferentes partes de su negocio. Cuando usted entiende exactamente lo que está impulsando su negocio, de dónde vienen las nuevas oportunidades y dónde se cometieron errores, puede ser proactivo para maximizar los ingresos existentes y revelar áreas de expansión. Las mejores decisiones se pueden tomar cuando usted tiene más visibilidad en el conocimiento vital que viene de su propia compañía.
Las soluciones SAP Business Intelligence (BI) proporcionan una ventana a su empresa. Un panel de control, por ejemplo, es una visión general única, confiable y en tiempo real de su empresa. Le ofrece una visión rápida, en formatos atractivos visuales que son fáciles de entender. También tiene pruebas de "qué si" que le permiten medir el impacto de un cambio en particular en el negocio. Esto también se puede hacer disponible en dispositivos móviles, por lo que puede tomar decisiones informadas on-the-move. Cuando tiene información en la que puede confiar, puede actuar rápidamente y mantenerse a la vanguardia del juego.
Con años de experiencia en BI, Clariba ha ayudado a varias compañías a obtener información de sus datos. Por ejemplo, el departamento de marketing de Vodafone Turquía solicitó nuestra ayuda para proporcionar al equipo de gestión del valor del cliente una herramienta de visualización y análisis dinámica y fácil de usar para las campañas de marketing. Con el tablero central que entregamos , El equipo de marketing fue capaz de analizar las campañas existentes y diseñar esquemas para los nuevos basados en factores clave de éxito.
Puede obtener más información sobre las soluciones SAP BI aquí , Y también puede ver vídeos de SAP BI Solutions en YouTube . ¿Desea desbloquear esta información sobre qué impulsa su negocio hacia adelante? Contáctenos en info @ clariba o deje un comentario a continuación y descubra cómo SAP BI Solutions puede ayudarlo a lograrlo.
Clariba and Exxova bring you Exxova´s MyBI Mobile at GITEX 2012
Visit Clariba and Exxova at GITEX Technology Week 2012, check out Exxova MyBI in action and enter the drawing for a 10-user implementation of Exxova MyBI Cloud!

Clariba and Exxova will be present at the SAP stand at the GITEX TECHNOLOGY WEEK 2012, the #1 technology fair in the MEASA region, and considered by many, as one of the top information and communications technology (ICT) trade fairs in the world. Over 138,000 ICT Professionals, 18,000 C-level executives and more than 80% of the top ICT brands worldwide are expected in GITEX 2012, which will run from 14 to 18 octubre at the Dubai World Trade Center.
 As GITEX continues to uncover the latest IT trends, like the shift to enterprise mobility accelerating at a rapid rate on upcoming years, it is unsurprising that we find the “Mobile, Apps & Content” area at the exhibition floor. This is where you will find the SAP Stand. With Mobility at the core of their innovation agenda, and heavy investments to stay at the forefront of the enterprise mobility market, SAP will be present at GITEX , showcasing its leading solutions in mobile device management, mobile applications and development platform among others.
The SAP stand will also feature partners such as Clariba ─ an expert provider of business intelligence solutions and a specialist in SAP BusinessObjects working with Exxova Worldwide ─ global supplier of MyBI Mobile.
 The two companies have partnered to bring Exxova's MyBI Mobile™ solution to the EMEA region. MyBI Mobile is a business intelligence mobility solution, which allows users to instantly access enterprise-wide BI content from mobile devices. It provides business leaders with real-time mission-critical data whether in the boardroom or airport terminal. All existing content is available without the need for rewriting or re-platforming so you can enjoy speed, flexibility, application breadth and simplicity.
- Meet us at our joint pod within the SAP stand in Hall 6, Stand #57 for a hands-on demo of Exxova´s MyBI Mobile and for insights on enterprise mobility and information management from Marc Haberland and David Monks.
- We also invite you to attend our Expert Presentation ─ Information at the Point of Decision with MyBI Mobile ─ at the Seminar Area of the SAP stand, on the 17th October at 12:30, presented by David Monks.
- By visiting us you will be able to enter the drawing for a full implementation of Exxova MyBI Cloud for 1 year for 10 users (worth $5,000!).
“We are excited to go to GITEX; it has become one of the most important ICT events of the year. As a BI services and solutions provider, Clariba believes that it’s important for the entire SAP BusinessObjects BI portfolio to run on multiple mobile platforms," says Marc Haberland, Managing Director of Clariba. “Exxova’s MyBI Mobile solution is a very cost-effective, easy-to-use option to deliver that without compromising data security, and we think this is a great fit with the GITEX technology week, where attendants come to see innovative solutions that can help improve their work processes” Marc comments.
David Monks, Vice President of Exxova EMEA, complements, saying that “the opportunity to showcase our innovative MyBI Mobile solution delivering broad support of Business Intelligence across the SAP BusinessObjects family and beyond in conjunction with our partners Clariba and SAP is an exciting event for Exxova. We look forward to showing how easy it is to deliver mobile BI using Dashboards Design (Xcelsius) Flash-based dashboards, Webi Reports, Crystal and even Explorer onto mobile devices like the iPad without any re-engineering whatsoever and with only 1 or 2 days installation time”.
______________________________________________________________ SAP, Clariba & Exxova can be found in Hall 6, Stand #57 – Mobile, Apps & Content area
For more information on GITEX Technology week visit www.gitex.com
For more information on Clariba visit www.clariba.com or contact us at info@clariba.com.
For more information on Exxova Worldwide visit www.exxova.com or contact us at gitex2012@exxova.com.
Clariba Webinar – Decision Making goes Mobile with Exxova MyBI


Are you looking for a way to access your company data from your mobile device? With Exxova MyBI, you can!
Attend our Webinar (in English) on the 15th of May from 11.00 - 12:00 (UAE - GMT +4:00).
REGISTRAR AQUÍ
Currently, organizations have made significant investments in developing their Business Intelligence (BI) solutions. In the case of SAP BW and BusinessObjects, business and IT organizations have amassed hundreds of reports using tools such as Crystal Reports, Web Intelligence, and Dashboards (Xcelsius) from SAP. Additionally, significant efforts have been used to establish an enterprise security model. These combined efforts represent a considerable investment.
The existing market perception is that the current mobile devices cannot manage the heavy lifting of the data analytics comparable to today’s advanced and mature BI solutions, so businesses tends to modify their processes and content to adapt to mobile tools.
However, Exxova´s MyBI mobile app allows companies to leverage their previous investments. With it users can instantly access Enterprise wide content at crucial decision points at any location at any time without any major modification to any existing content. Users can print, change, update, and do all of the work that they currently perform on the enterprise system through a mobile device, increasing end user adoption.
We invite you to invest an hour of your time to get to know this solution and see it in action in our MyBI webinar. The agenda for the event is:
- Introducción
- Main features of Exxova´s MyBI mobile
- Main benefits of Exxova´s MyBI mobile
- Manifestación
- Preguntas y respuestas
REGISTRAR AQUÍ
For More information about Exxova MyBI visit our website.
Atentamente,
Xavier Marigó Sales Manager – Clariba ME
Xcelsius in BI on Demand (BIOD)
In this blog article I am going to talk about Xcelsius in SAP BI On Demand (BIOD). What I am going to explain are the steps that you should follow to upload an existing Xcelsius Dashboard to the BIOD system.
What is BIOD?
First of all, for those who don’t know what is BIOD I will give a brief explanation. Basically we can say that BIOD is the most complete and approachable cloud based business intelligence suite available in the market today. BIOD is software as a service; you do not need to install any software on your machines to get instant value from the system. All you need to do is Log in and provide some data. It is a cheap BI solution, due to the fact that you don’t need to make a huge investment in hardware, licenses, etc... everything is in the net. The target for this technology is small companies, which are less likely to be able to acquire a BI system due to the costs, but with BIOD they have an accesible way into SAP BusinessObjects analysis system. In BIOD you are able to create:
- Xcelisus Dashboards
- Web Intelligente reports
- Explorador
You can get more information about BI On Demand here.
Now, let´s see how to upload an existing XCelsius Dashboard to the BIOD system.
How to upload an Xcelsius Dashboard to BIOD?
First of all, if you don’t have a BIOD account you should create it. It s free, and with it you will able to test most of the features of this cloud system. Click here to Sign up.
Once we are logged, we will see this screen.

Now I want to show you how you should upload an existing Xcelsius file with static data to the BIOD system.
First of all we should create the DataSource, so in my Stuff panel we should select Datasets. After that we click Add New Button -> Add Dataset

Then we should chose from which place we will select the dataset. We have several options: Create From Query (this option is only available in the BIOD Advanced version, where the connection to a universe is possible), bring data from salesforce or create an empty dataset from scratch and finally, we can upload a file (xls,xlsx or csv) which we will use in this example.

As I said before, we select an excel file as source of our dataset, in the first row of our excel file it is important to have the labels of each column. We can also edit this dataset, change the value type of each column, the label name, etc...

At the bottom of this page we can find the properties section, here we should enable the Web service. Once we have done this, the system will generate a url that will be the reference to the dataset in our dashboard.

The next step will be to upload the Xcelsius file as a template, so we select Add New -> Add Template.
We create a name for this template, uncheck the Create a new Xcelsius file check box and finally, select the xlf file that we have locally.

The screen below will then appear. In order to connect the dataset to our xlf file we should select the blue sentence (you may click here to edit the Xcelsius file). You can also attach an image of the dashboard as a thumbail for repository. The object selection will be fancier.

Once the Xcelsius editor is opened we add a connection using OnDemand -> Add Connection menu option. This will create one Flash Variables connection ([Flashvar]) and two Web Service Connections ([OD_Data1 and OD_Data2). In our case we should delete one data connection because we only have one source, but in case we need more data sources we can create as many as we want. It will also create a new tab in the XC spreadsheet that contains these cell bindings.
After that we configure the data connections. Open the Data Manager (Data -> Connections) and you will see a Connection of type FlashVars. You should see the following:
- get_data_url: (mandatory). This should be bound to the cell which the Web Service Url of the Web Service Connections are also bound to. If you have multiple connections this should be bound to the range which holds those connections.

Then each Web Service Connection (OD_DataN), in our case only OD_Data1 points to the set of cells to which that connection outputs its data.
These are the next steps that you should follow in order to setup the dashboard:
- Click on My Datasets and click copy beside the dataset OD_Data1.
- Paste the url from dataset to the WSDL URL input box of a Web Service connection

- Click Import to import the schema.

- Bind the web service url to the same cell as get data url (Note: if you used the Add Connection process this should already be done).
- Bind the headers and the row values.
- Set Refresh on Load to be true.
After these steps you can save your changes and then click the Back button to go back to Edit Connection step of creating a template. You should see your connection listed on the screen.

Click Next to go to the Edit Sample Data step, you can choose to add in your sample data from the XLF if you like, and then click Finish.

Finally we will create a visualization using this template. We select our Data Input, in this case Data Source.

If we go to the visualization menu we can find the object.


In conclusion we can say that the BIOD system is a nice tool to start testing the power of the SAP solutions without a potential heavy investment at the beginning. It can be also a good tool to make demos on and show our dashboards to customers. It is very interesting to test the explorer tool, you can see the amount of options that the BIOD brings you in terms of data analysis. If you are interested in the advanced solution you should get in touch with SAP.
If you have any comment or doubts do not hesitate to contact us or leave a comment below.